


Semiconductors are at a crossroads, with innovation fueling growth and tariffs threatening profits. How might you navigate this potentially volatile landscape and identify opportunities without getting burned?
In 2025, analysts predict AI will drive explosive demand in the semiconductor industry, fueling innovation and revenue growth. At the same time, this optimism is tempered by the new administration’s tariff policies, which threaten to disrupt global supply chains, increase costs, and reshape the competitive landscape for chipmakers.
This tug-of-war between bullish and bearish forecasts is best exemplified by the VanEck Semiconductor ETF (SMH) price action, a reliable proxy for the semiconductor industry. Here’s a weekly chart.
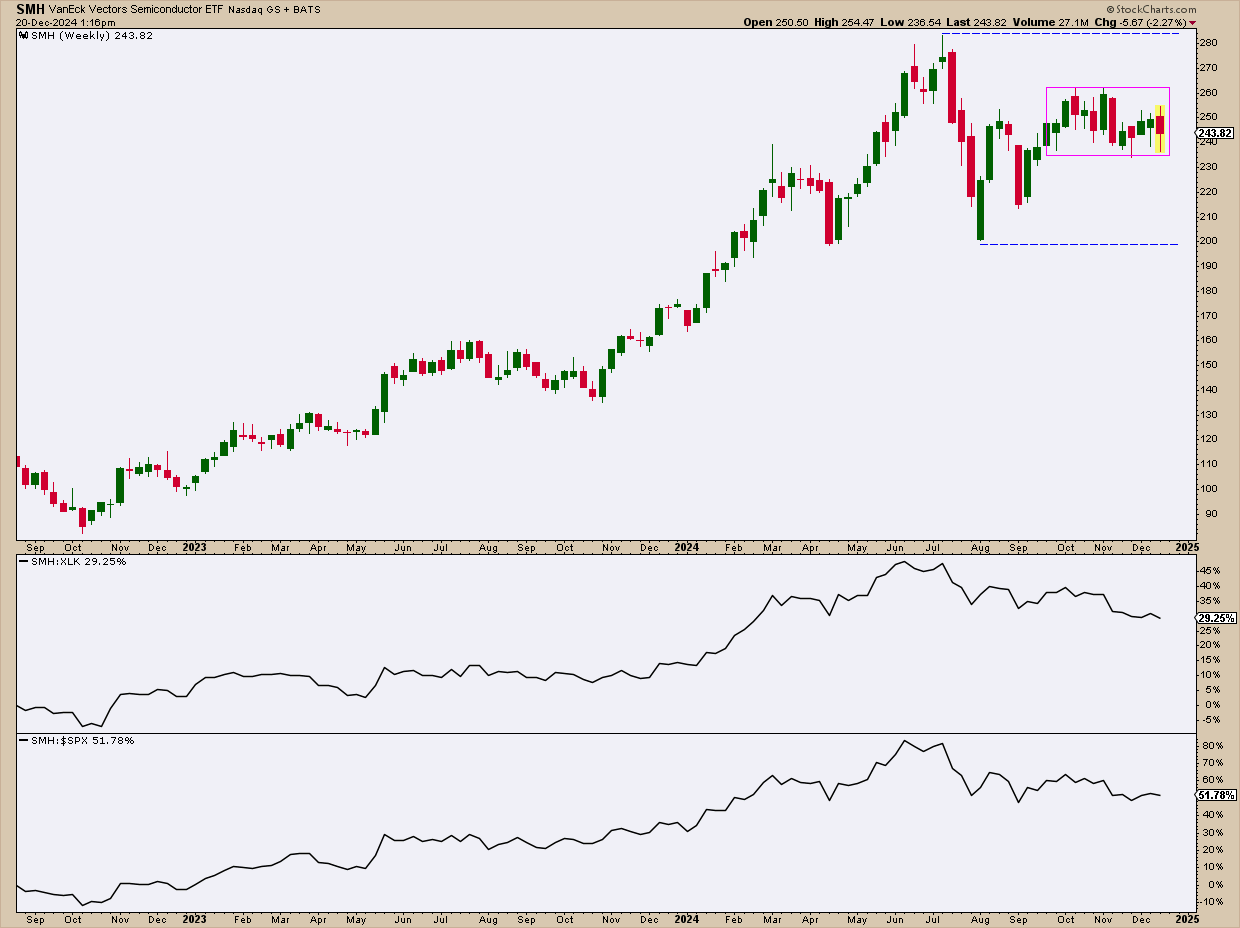
FIGURE 1. WEEKLY CHART OF SMH. Congestion narrowing within a wider trading range may indicate that bulls and bears are in temporary equilibrium, with neither buyers nor sellers showing enough conviction to drive a decisive breakout or breakdown. Chart source: StockCharts.com. For educational purposes.
There’s a narrowing, range-bound movement between its all-time high near $283 and the swing low of $280 (see blue dotted lines). The increasingly tight congestion range over the last three months, as highlighted by the magenta rectangle, suggests increased indecision among bulls and bears. Despite the temporary standstill, semiconductor stocks are outperforming their tech sector peers (see price performance against XLK) by only 29% and the S&P 500 by 51%.
While AI chip demand will likely see significant growth in the future, the effects of tariffs and reshoring may bring sharp and near-term pain to most chipmakers, particularly semiconductor companies that are most reliant on Asian production. Domestic chipmakers with minimal reliance on overseas manufacturing may fare better under these conditions.
With that in mind, let’s take a look at SMH’s top three holdings—NVIDIA Corp. (NVDA), Taiwan Semiconductor Manufacturing Company (TSM), and Broadcom Inc. (AVGO)—all of which play a leading role in AI chip development, but have different levels of reliance in the global chip supply chain.
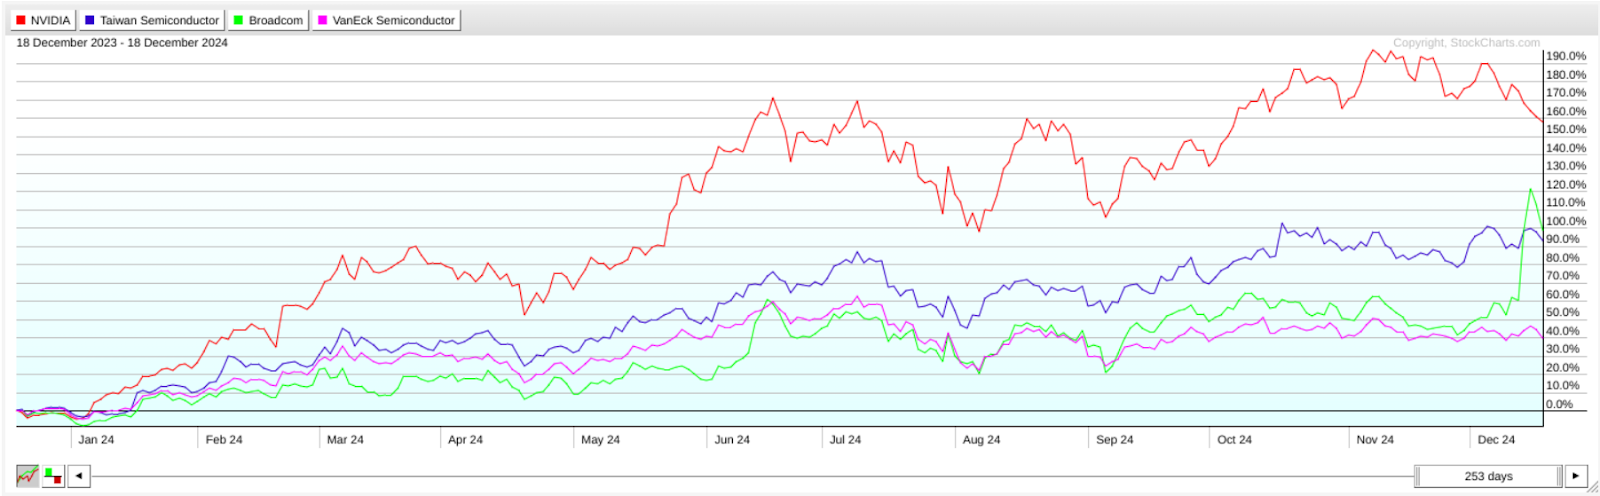
FIGURE 2. PERFCHARTS COMPARING SMH AGAINST ITS TOP THREE HOLDINGS. Note the late jump in AVGO. Chart source: StockCharts.com. For educational purposes.
All three of SMH’s top holdings are outperforming their industry peers with NVDA on top, TSM second, and AVGO third. Understanding that late jump in AVGO might require some context (which we’ll get into later).
- NVDA is the world’s AI chip leader.
- TSM, is the world’s top chip foundry, and main producer of NVDA’s GPUs.
- AVGO is a diversified supplier of data center components which are the backbone of AI infrastructure. Unlike NVDA, its business model is less exposed to reshoring effects.
NVIDIA (NVDA): The AI Semiconductor Leader
Take a look at the rounding top pattern on the daily chart.
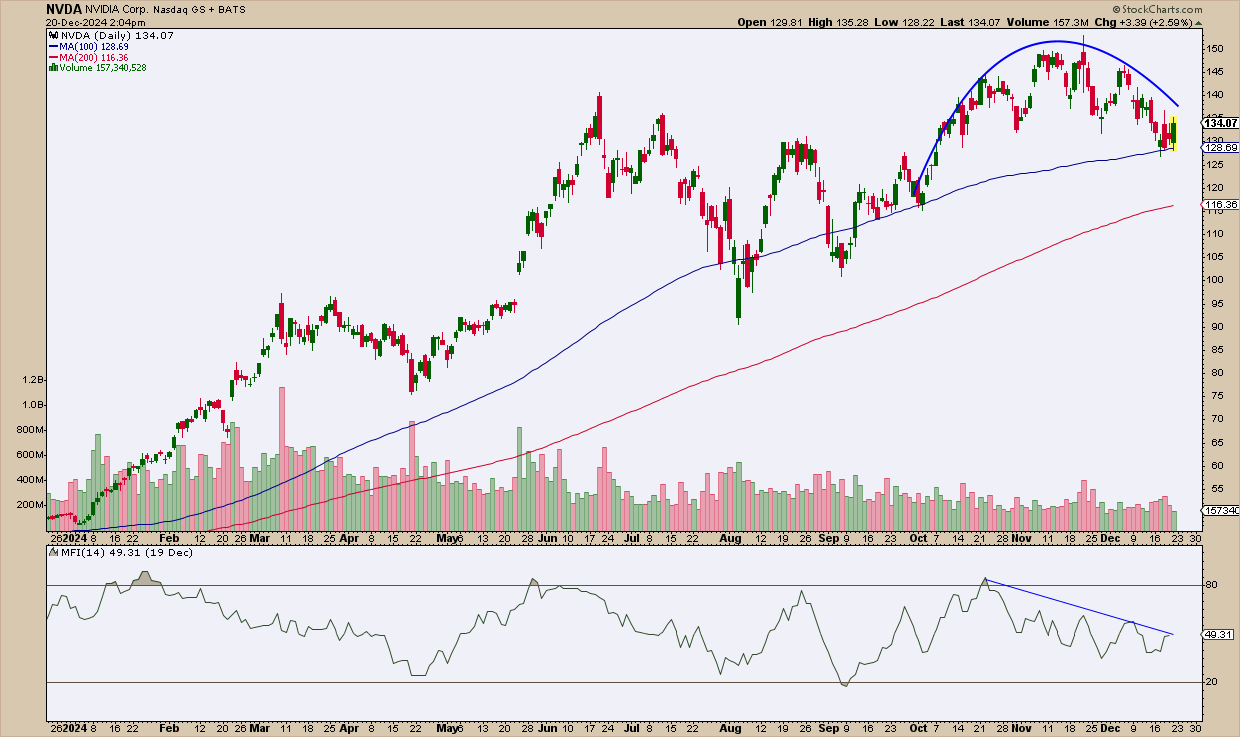
FIGURE 3. DAILY CHART OF NVDA. Rounding tops are bearish, but tend to break higher more than 50% of the time. Chart source: StockCharts.com. For educational purposes.
According to Thomas Bulkowski’s Encyclopedia of Chart Patterns, while rounding tops are typically viewed as bearish, more than half the time they break upwards, challenging that assumption. In many cases, the rim on the right is higher than the one on the left. In the case above, the rim is formed by a price bounce off the 100-day simple moving average (SMA).
Both the 100-day and 200-day SMAs are likely to act as strong support unless there is a significant change in the chipmaker’s fundamentals. While NVDA’s uptrend remains intact, momentum seems to be weakening as suggested by the decline in the money flow index (MFI). Keep an eye on this development, especially if it breaks below the 100-day SMA and bounces off the 200-day SMA.
Next, let’s take a look at NVDA’s main chip foundry: TSM.
Taiwan Semiconductor Manufacturing Company (TSM): The Foundry
TSM’s daily chart doesn’t look too different from NVDA’s. Remember, TSM is NVDA’s main chip foundry, and so NVDA is highly dependent on TSM (rather than the other way around).
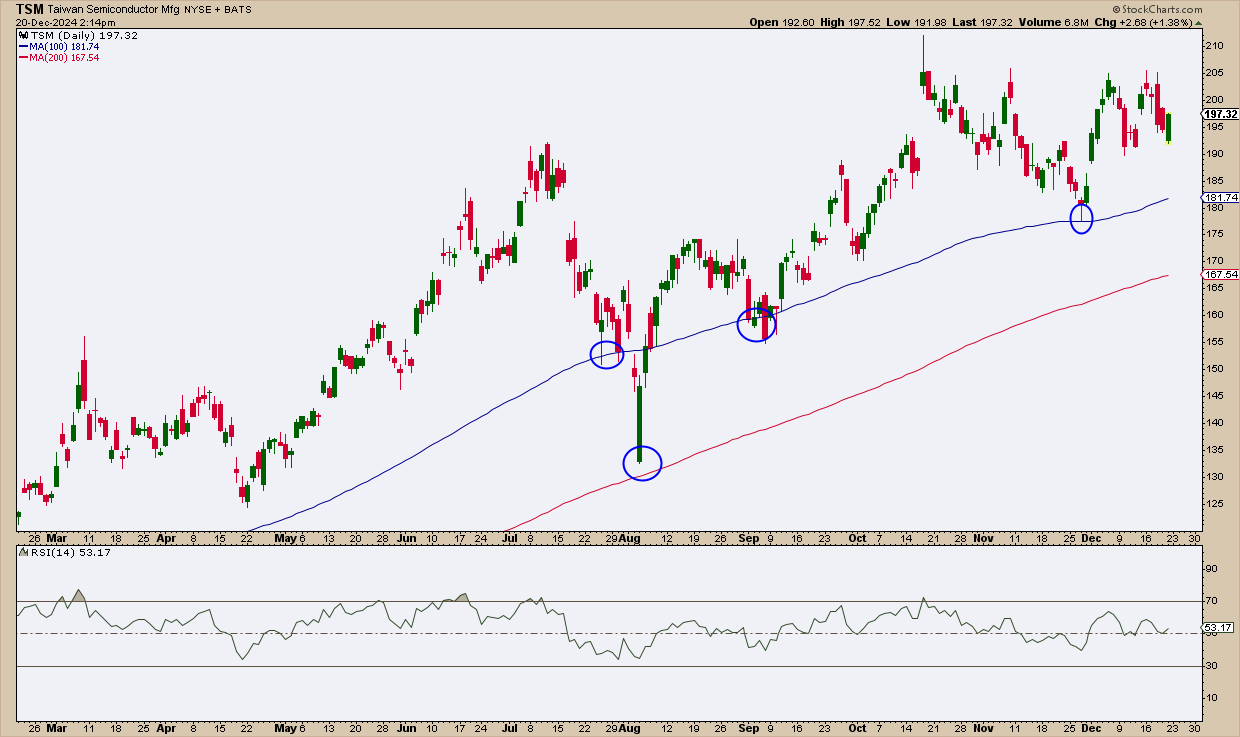
FIGURE 4. DAILY CHART OF TSM. The stock’s price is chugging along with plenty of support. Chart source: StockCharts.com. For educational purposes.
You can see the difference between the stock’s volatile rise in price against a gradual decline in the RSI. TSM’s recent price action over the last three months has succumbed to this drop in bullish momentum.
The stock is reacting strongly to the 100-day and 200-day SMAs, suggesting a high likelihood of bouncing off these levels again should price continue to decline from the current levels.
Broadcom (AVGO): A More Diversified AI and Semiconductor Play
Broadcom also uses TSM’s foundry services, but it has a few other foundries in Asia and Europe. Because of its wide range of products and its focus on data centers, AVGO is more diversified and less exposed to the same supply chain risks as NVDA. Perhaps this (plus the company’s optimistic 2025 revenue projection) is why its shares have recently outperformed the other two companies above, hitting an all-time high in late December.
Let’s take a look at AVGO’s daily chart.
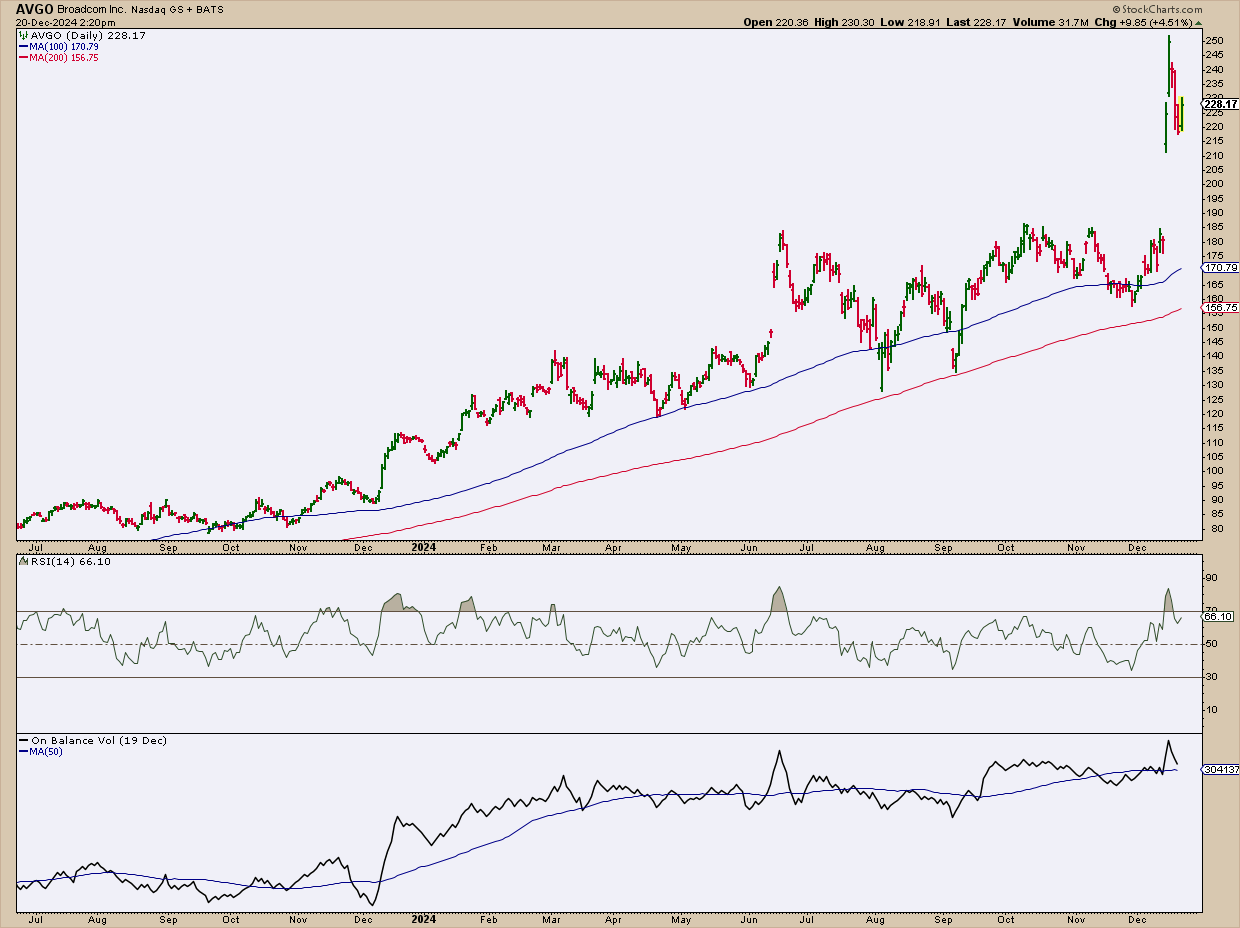
FIGURE 5. DAILY CHART OF AVGO. The December gap followed strong company guidance. Chart source: StockCharts.com. For educational purposes.
AVGO’s uptrend going back to November 2023 runs a similar course to NVDA and TSM. Its uptrend experienced some moments of volatility yet remained relatively sold. Its price fluctuations also reacted strongly to both the 100-day and 200-day SMAs, finding support with both.
However, unlike our previous examples, momentum as measured by the RSI appears steady and somewhat cyclical. To get a clearer view of momentum with volume, I added the On Balance Volume (OBV) with a 50-day SMA overlay which shows that buying pressure has steadily been increasing, fueling AVGO’s ascent, and culminating in the bullish jump in December.
Whether or not price falls to fill the gap, you might wait for RSI to dip below the 50-line to better time an entry if you’re looking to go long.
At the Close
The semiconductor industry faces a dynamic and uncertain 2025, with AI demand poised to spur growth while tariff talks threaten to reshape global supply chains and profit margins. Keeping an eye on SMH and monitoring its top holdings—NVDA, TSM, and AVGO—for shifts in momentum and action at key levels is critical if you’re looking to time your trades in this promising space.

Disclaimer: This blog is for educational purposes only and should not be construed as financial advice. The ideas and strategies should never be used without first assessing your own personal and financial situation, or without consulting a financial professional.