

The Yield Curve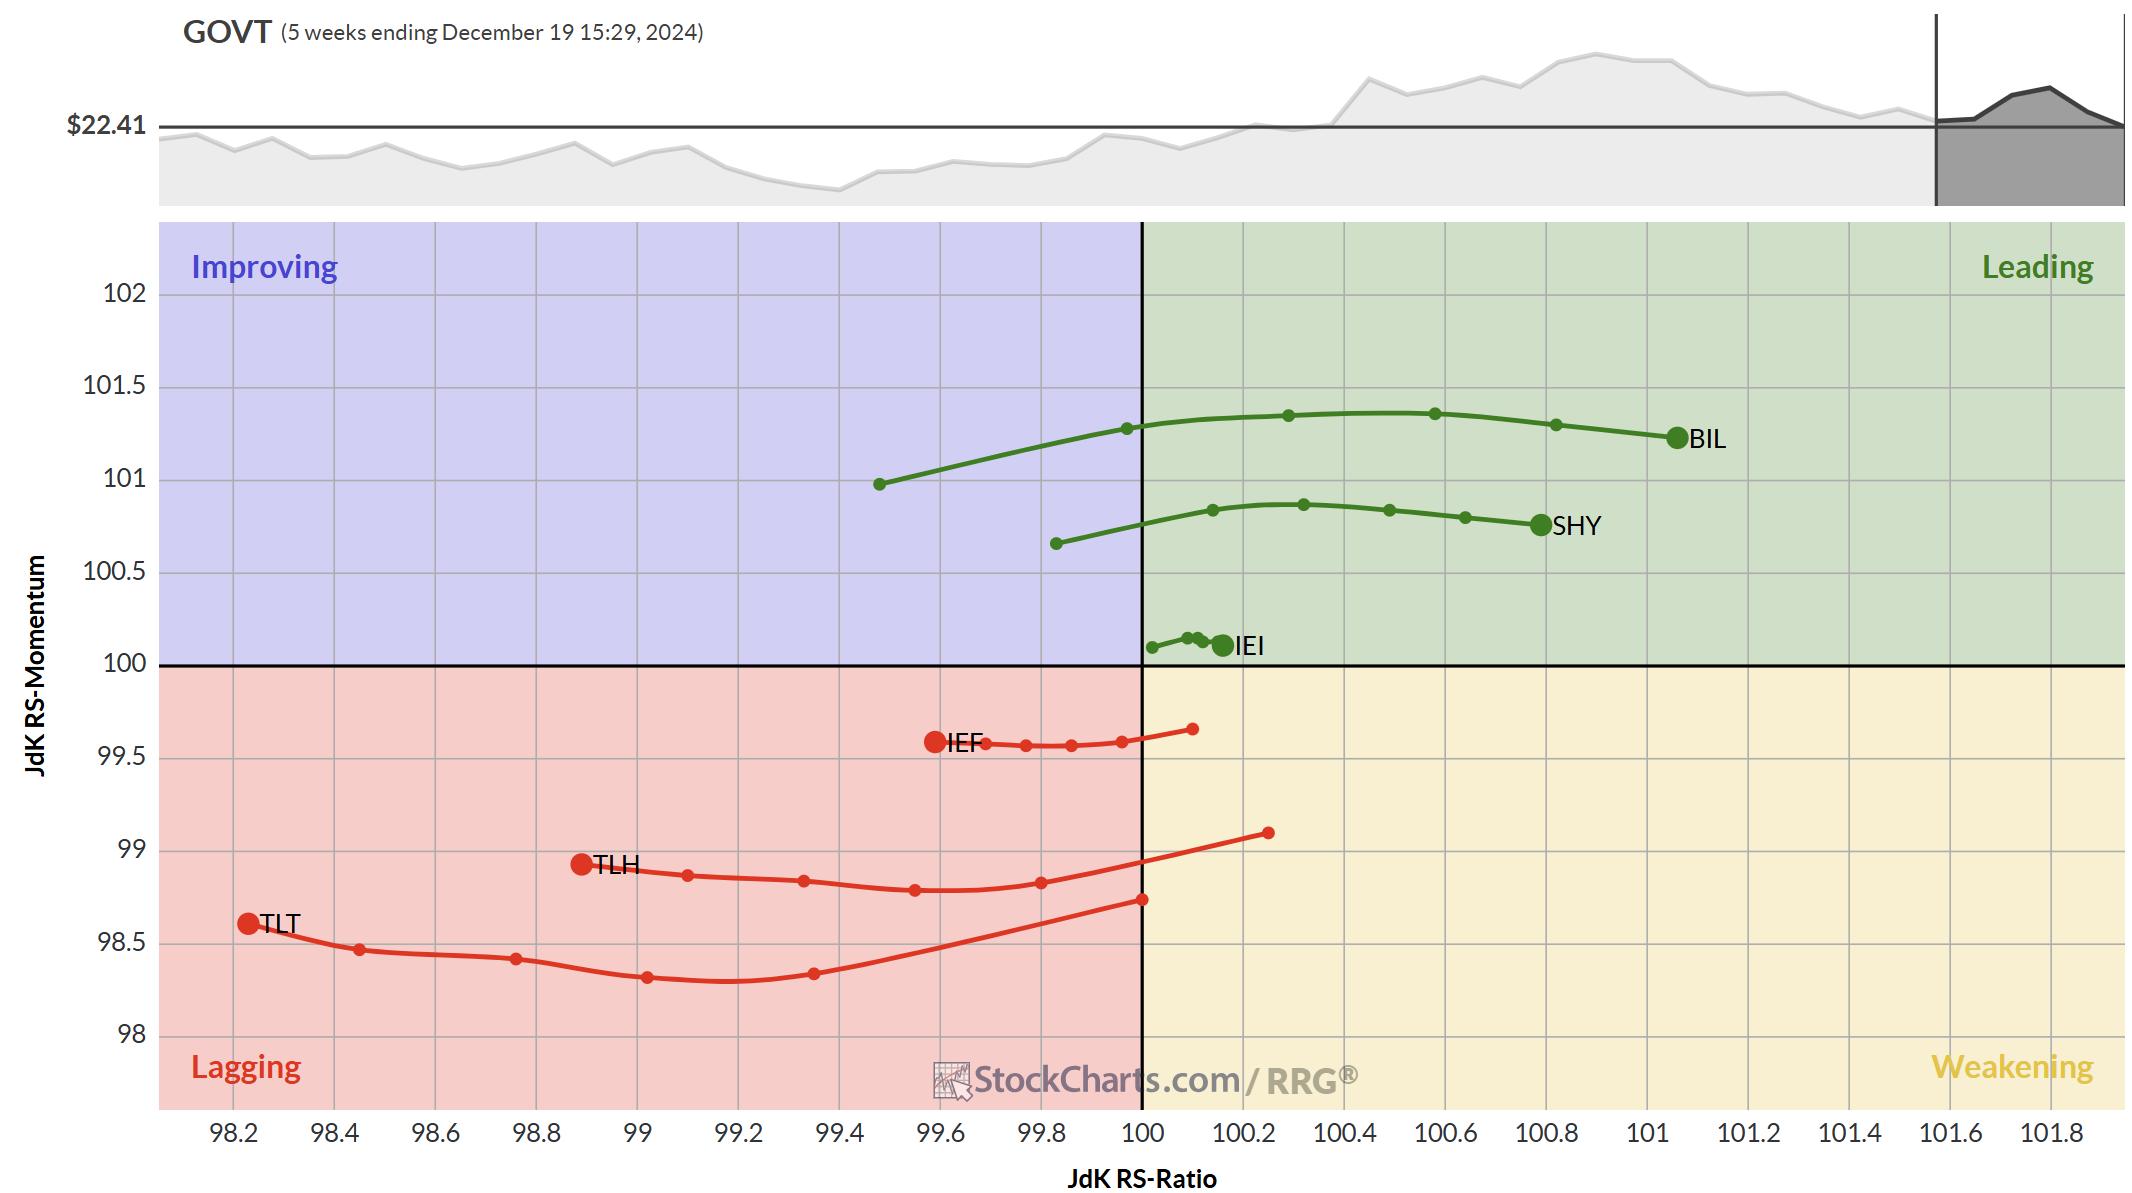
The RRG above shows the rotations of the various maturities on the US-Yield Curve.
What we see at the moment is that the shorter maturities like BIL, SHY, and IEI are in relative uptrends against GOVT which means that the accompanying yields are being pushed lower.
The longer maturities, all inside the lagging quadrant, are in opposite moves and their yields are being pushed higher.
The result of such a rotation is a so-called “steepening” of the yield curve.
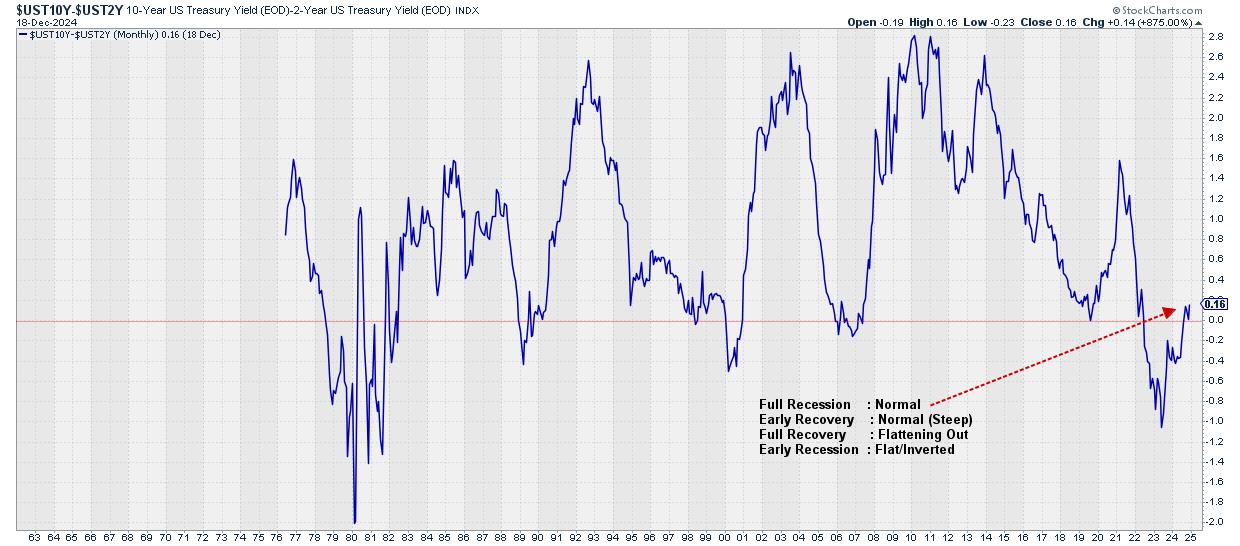
This chart shows the 10-2 yield curve. 10-year yield minus 2-year yield. In a normal situation, longer-dated maturities carry a higher yield than shorter-dated maturities. For almost 2.5 years this was not the case in the US. The negative values in the chart above indicate an “inverted” yield curve. This has happened a few times in the past but it is considered non-normal.
The recent rise of the 10-2 difference above 0 indicates a return to normal for the US yield curve.
Another way of showing the move of the yield curve is by using the Dynamic Yield Curve tool on the site. Here are three snapshots of the YC move since mid-2022.

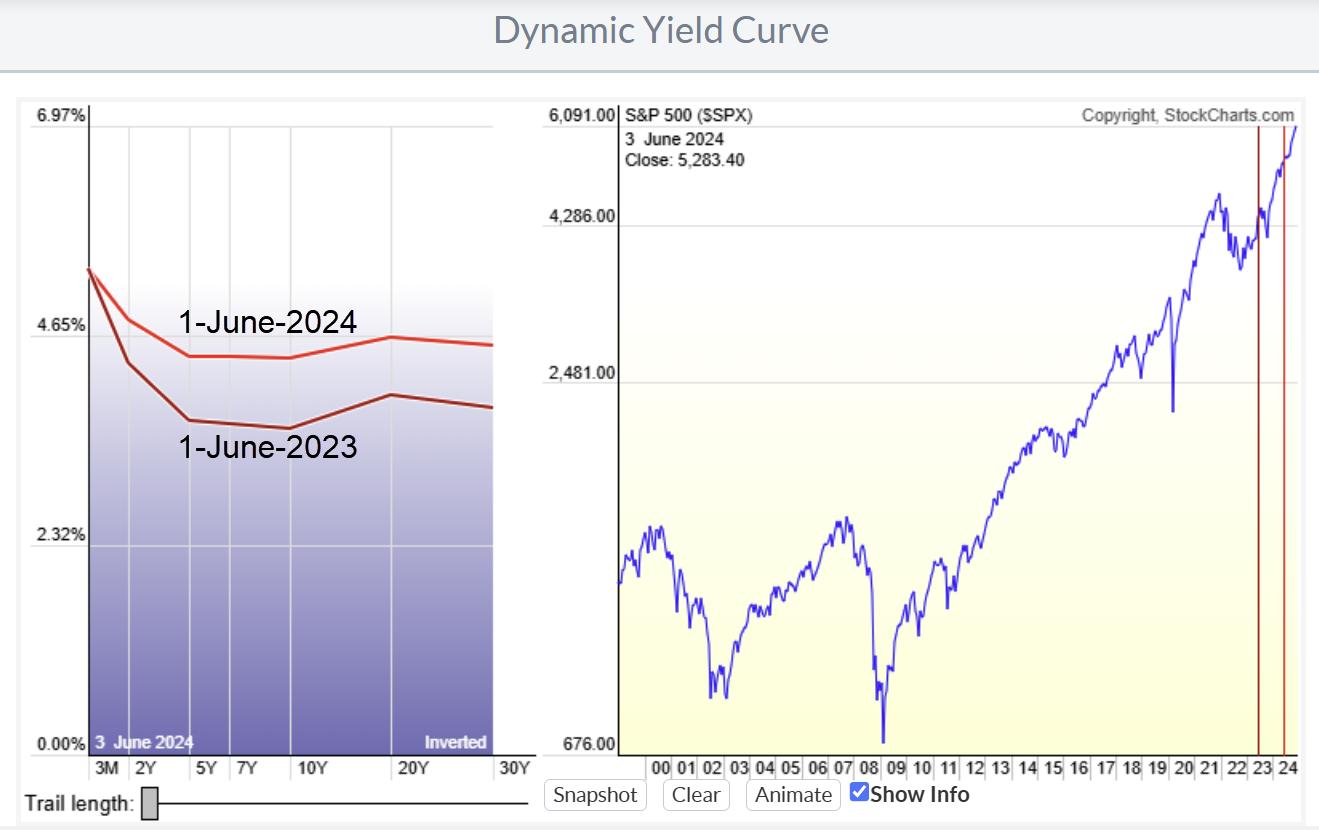
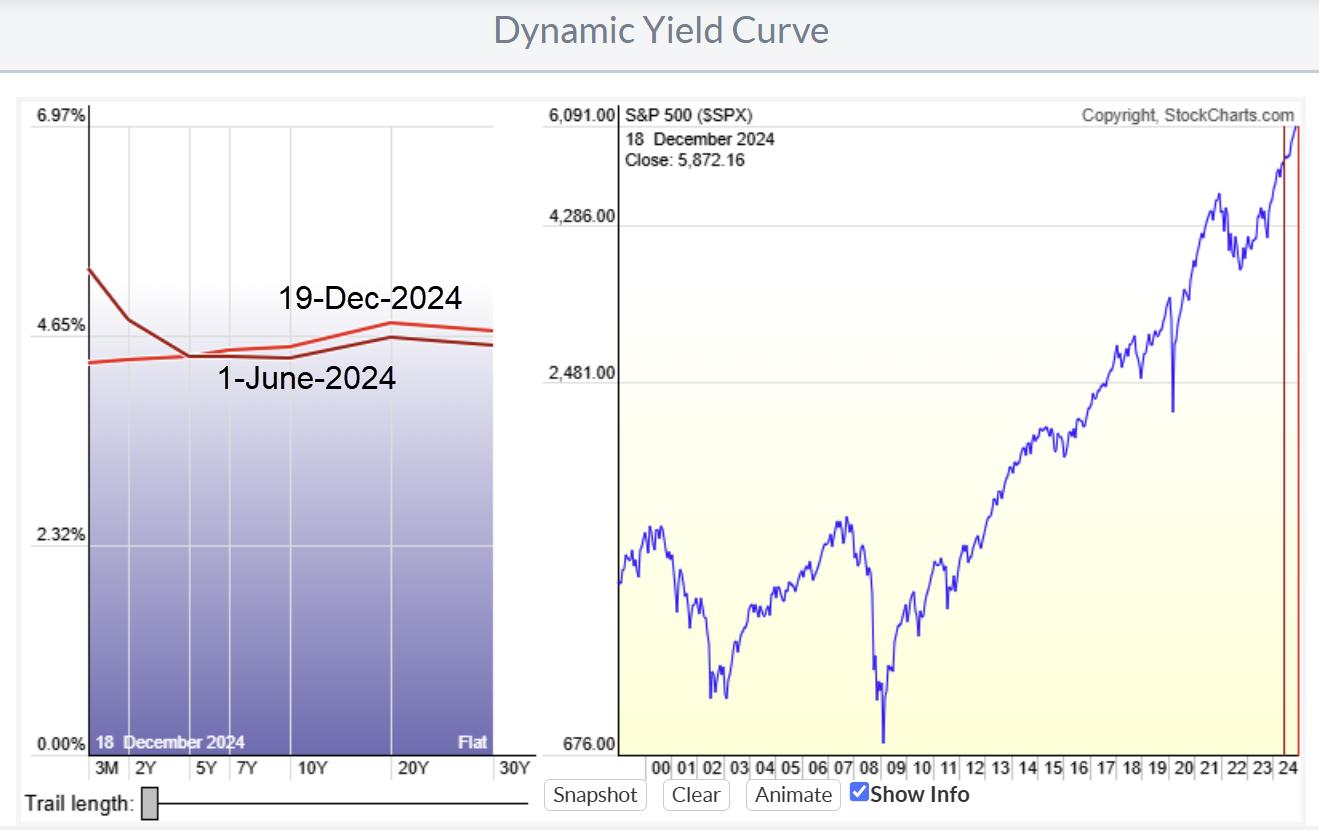
This visualization shows the love of the entire curve. It not only shows the steepening vs flattening move but also the rise of the total curve of around 2% from just above 2% to over 4.5% currently.
The Relative Rotation Graph showing the rotations of the various maturities will help investors to keep track of the steepening/flattening move.
The US Dollar
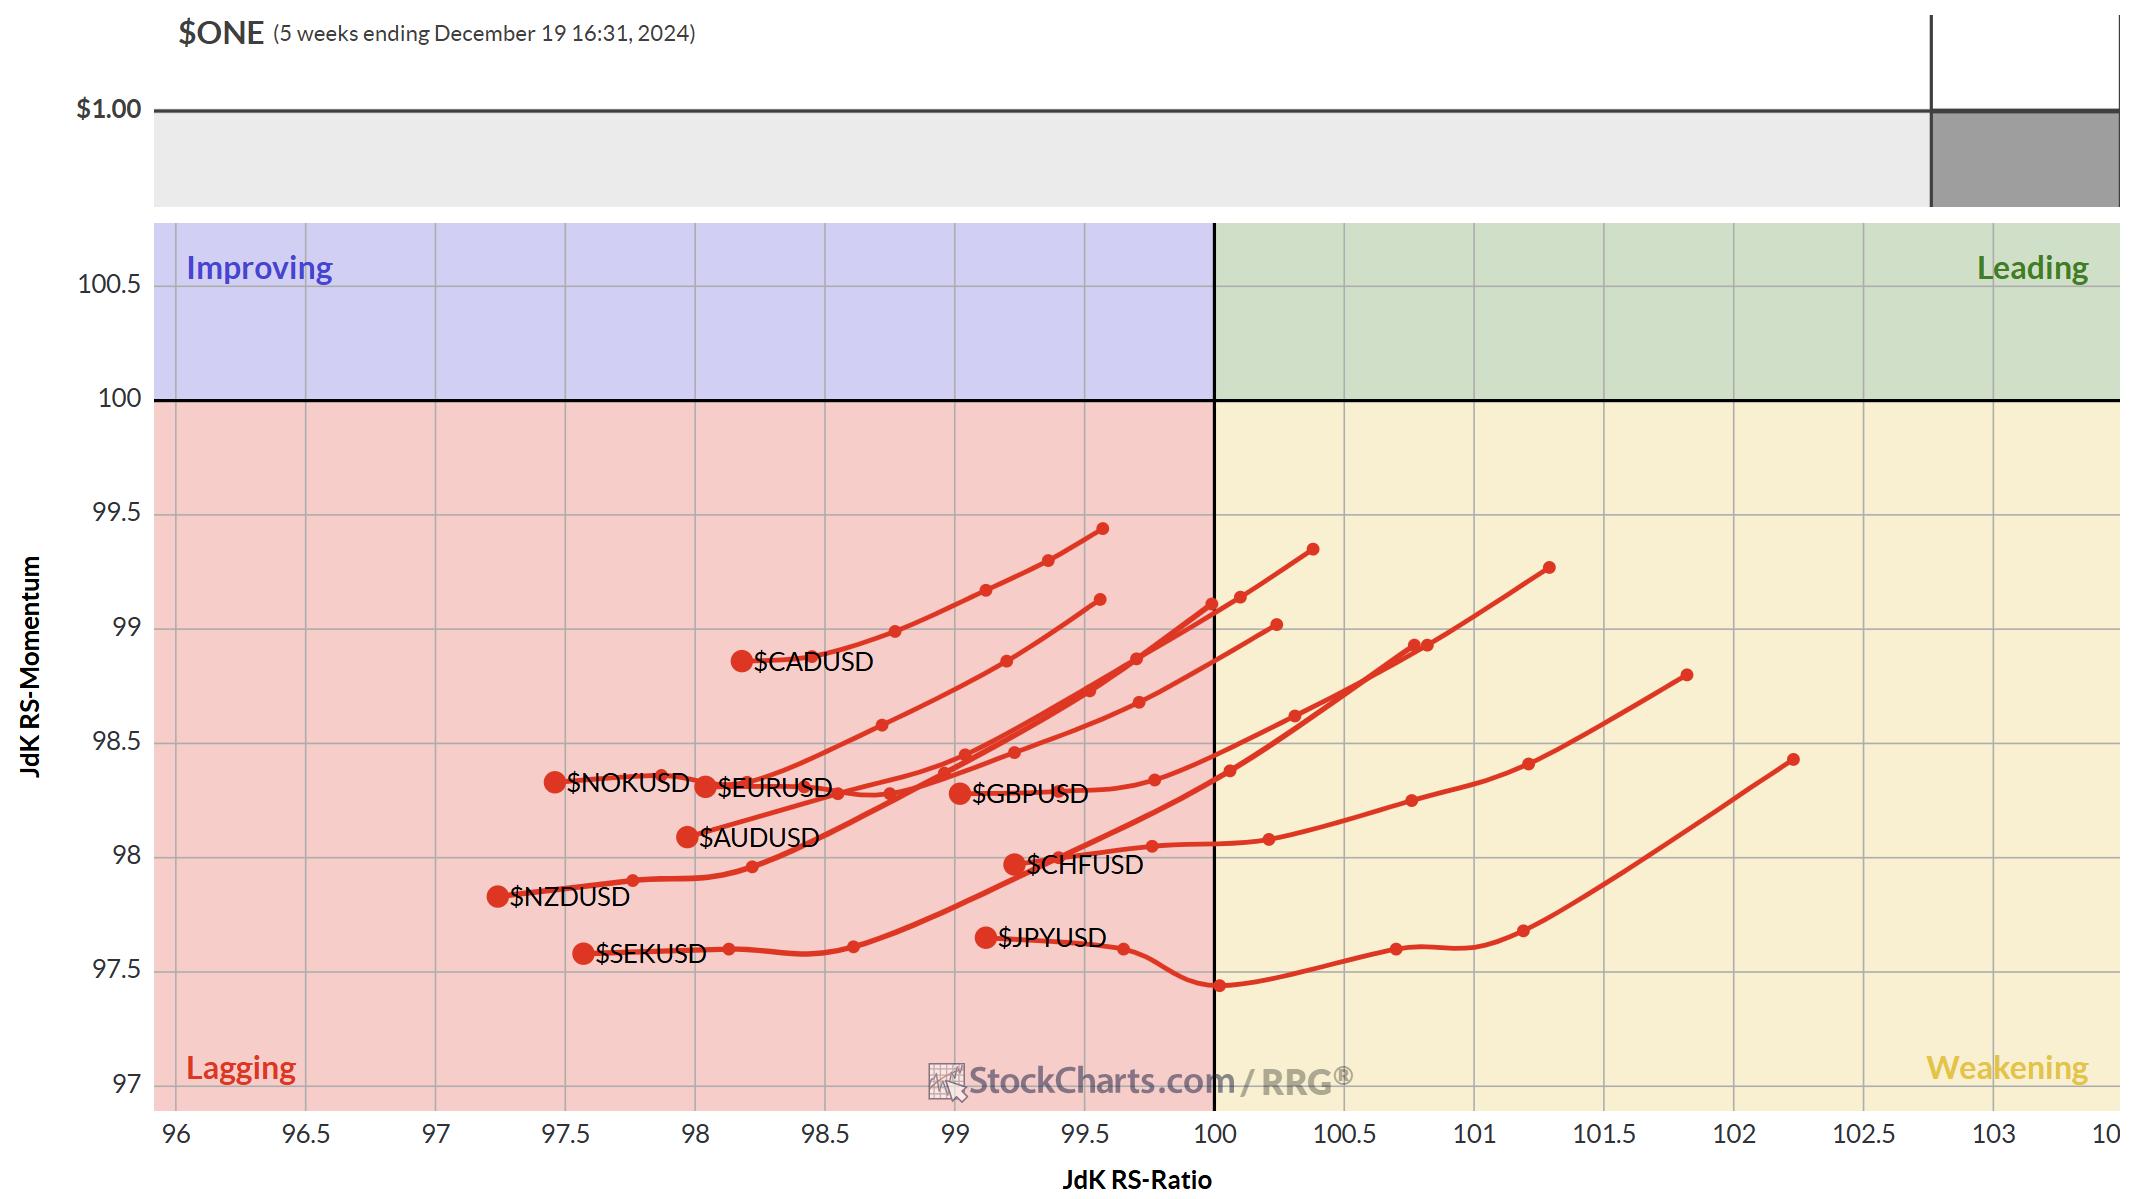
The RRG for the G10 currencies, using the USD as the benchmark, shows a picture that could not be more clear.
The USD is the strongest currency at the moment.
All currencies in this group are, moving further, inside the lagging quadrant, indicating downtrends against the USD which is the center of the RRG.
This is a pretty massive move showing the strength of the USD against all other currencies.
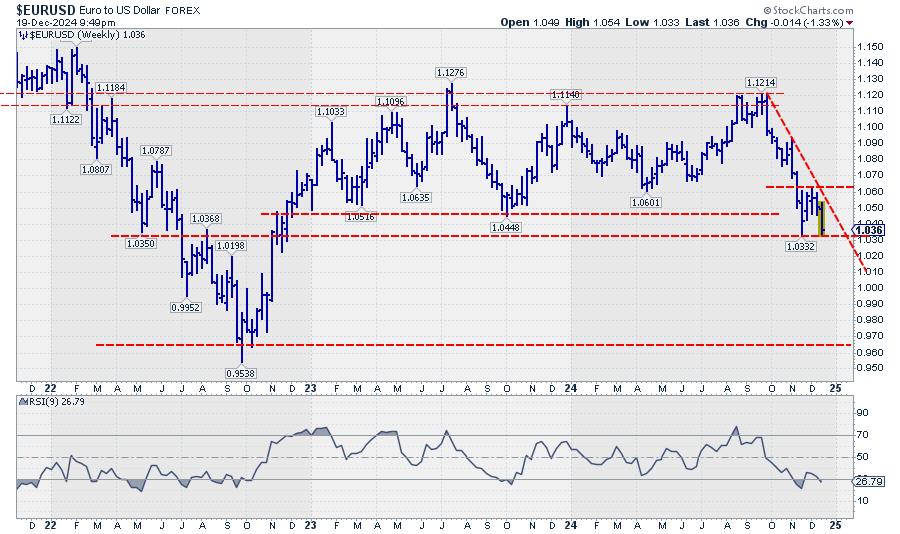
On the EUR/USD chart, we can see a test of a major support level of around 1.03.
Once that support breaks, the way down is wide open towards the 0.96 area where the market bottomed out in 2022.
On the flip side. When support holds and EUR/USD can take out 1.06 we will have a completed double bottom targeting the upper boundary of the current range.
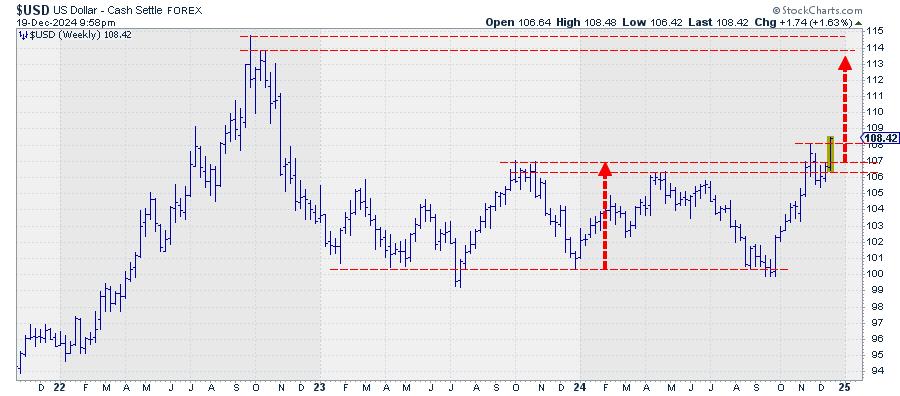
Looking at the $USD index chart, which is the USD expressed against a basket of currencies, we see that an upward break has already taken place. Taking this as a lead suggests that the odds are tilted in favor of a downward break in EUR/USD.
Sectors and SPY
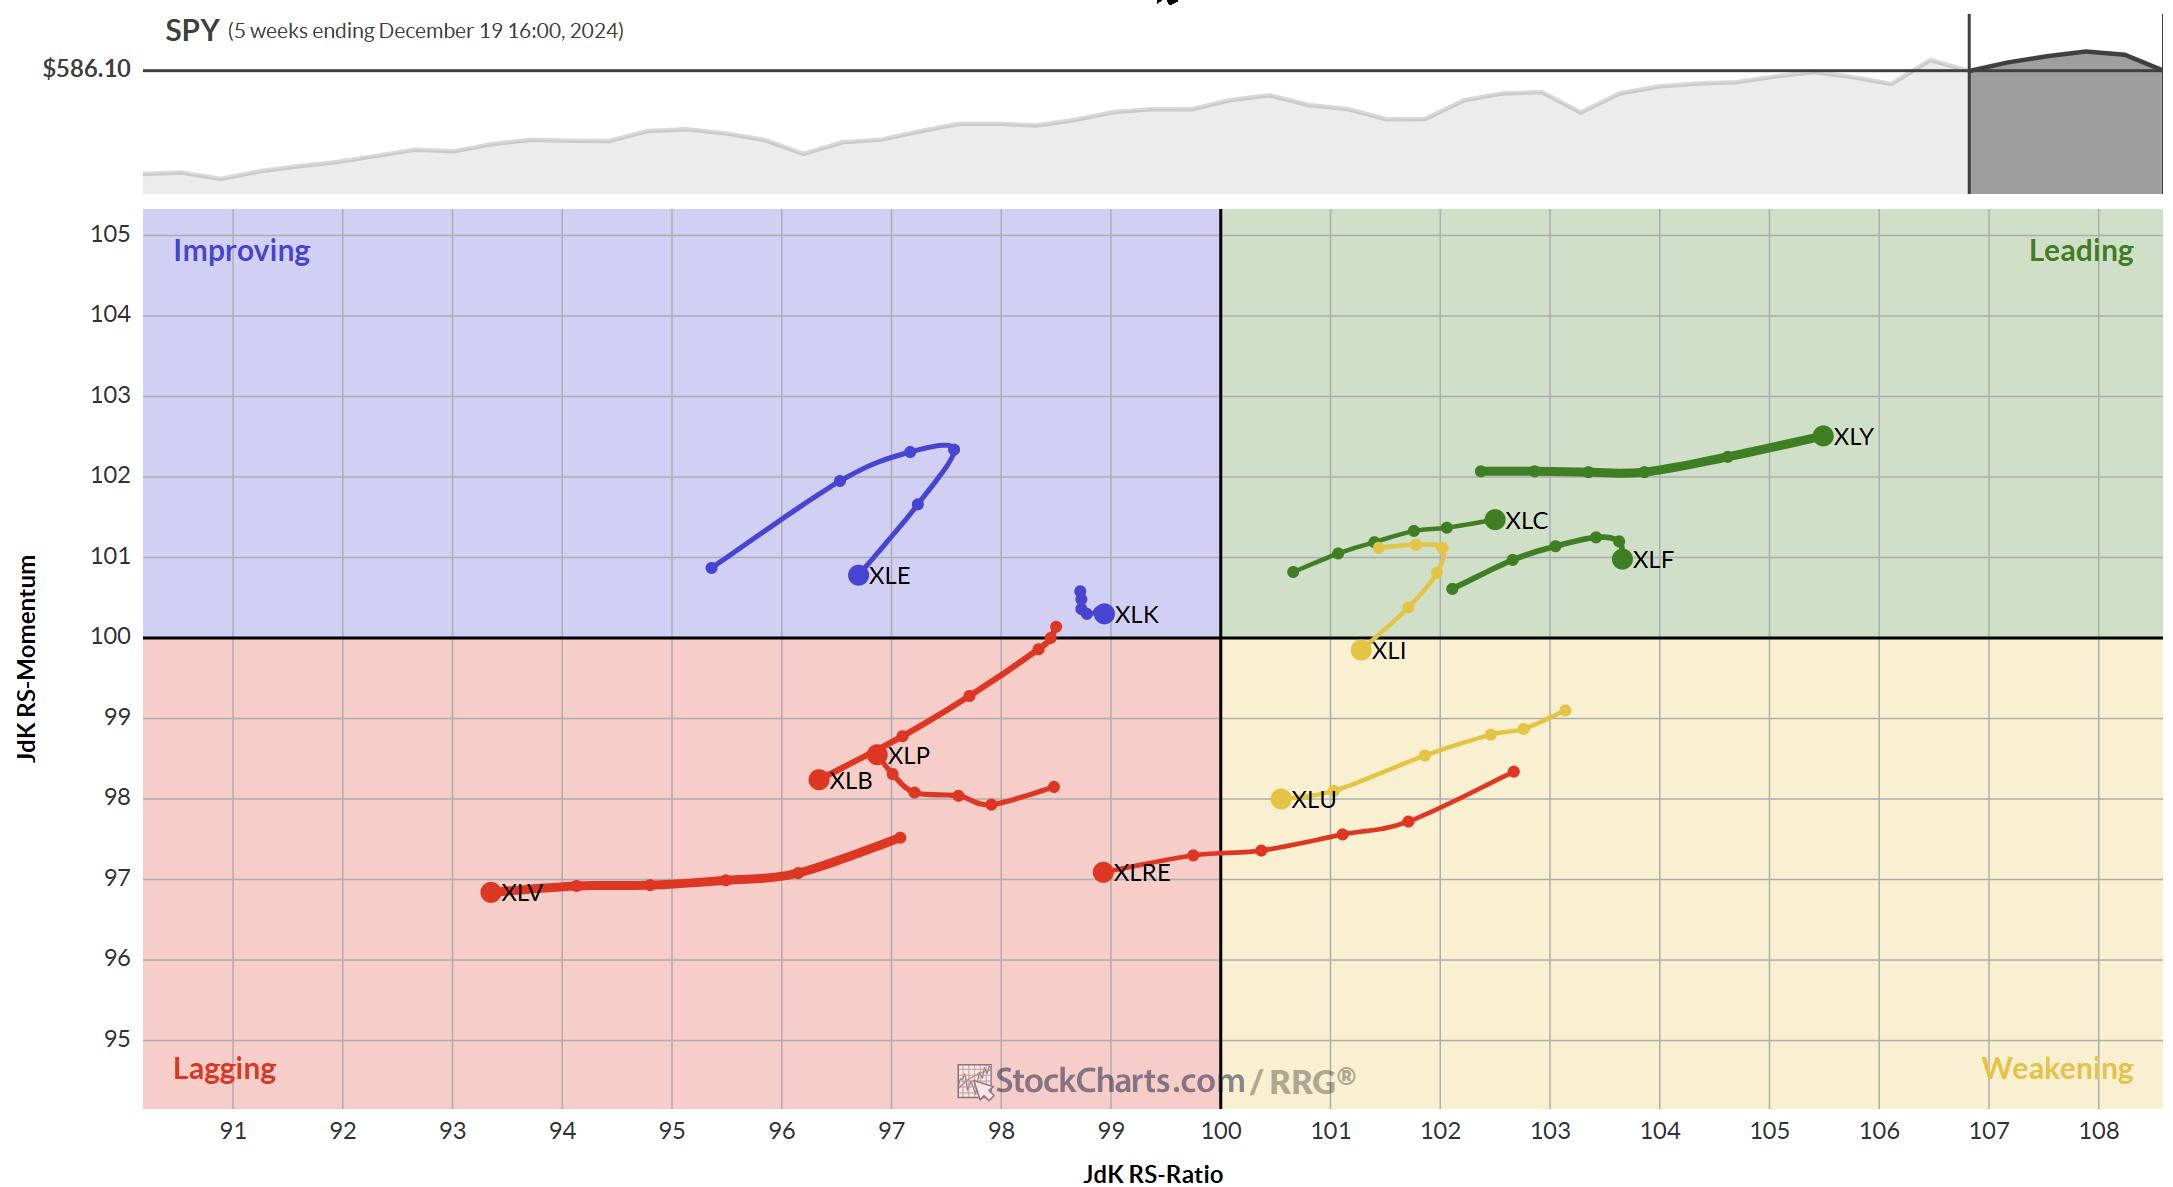
Despite the big drop earlier this week, the sector rotation on the weekly RRG has not drastically changed (yet). So far the strength for XLC and XLY remains present. Only XLF has rolled over but remains inside the leading quadrant.
A similar observation can be made on the daily version of this chart.

On the weekly chart of SPY, the price has dropped back to a double support area around 585 where the rising support line meets horizontal support coming off the October high.
So far this all remains within “normal behavior” for an uptrend.
When SPY breaks that double support level and leaves the channel a re-assessment of the situation is needed.
#StayAlert and have a great weekend — Julius