

 As the FOMC prepared to announce its rate decision on Wednesday, the Financial Select Sector SPDR Fund (XLF), which had been steadily climbing since the end of 2023, was approaching a new record high. Moreover, the Fed’s decision held little surprise — its stance had been well-telegraphed in the weeks leading up to the announcement. Wall Street widely expected rates to remain unchanged.
Yet, as Jerome Powell spoke following the FOMC decision, XLF and the rest of the stock market declined. At the end of the day, XLF notched a gain, but one that barely scratched above its opening price.
In after-hours trading the next day, XLF quietly broke into all-time high territory, surpassing $51.40. Some investors might be asking whether they should have bought XLF at the breakout. To answer that, let’s start with a weekly chart to gain a broader perspective on XLF’s trajectory.
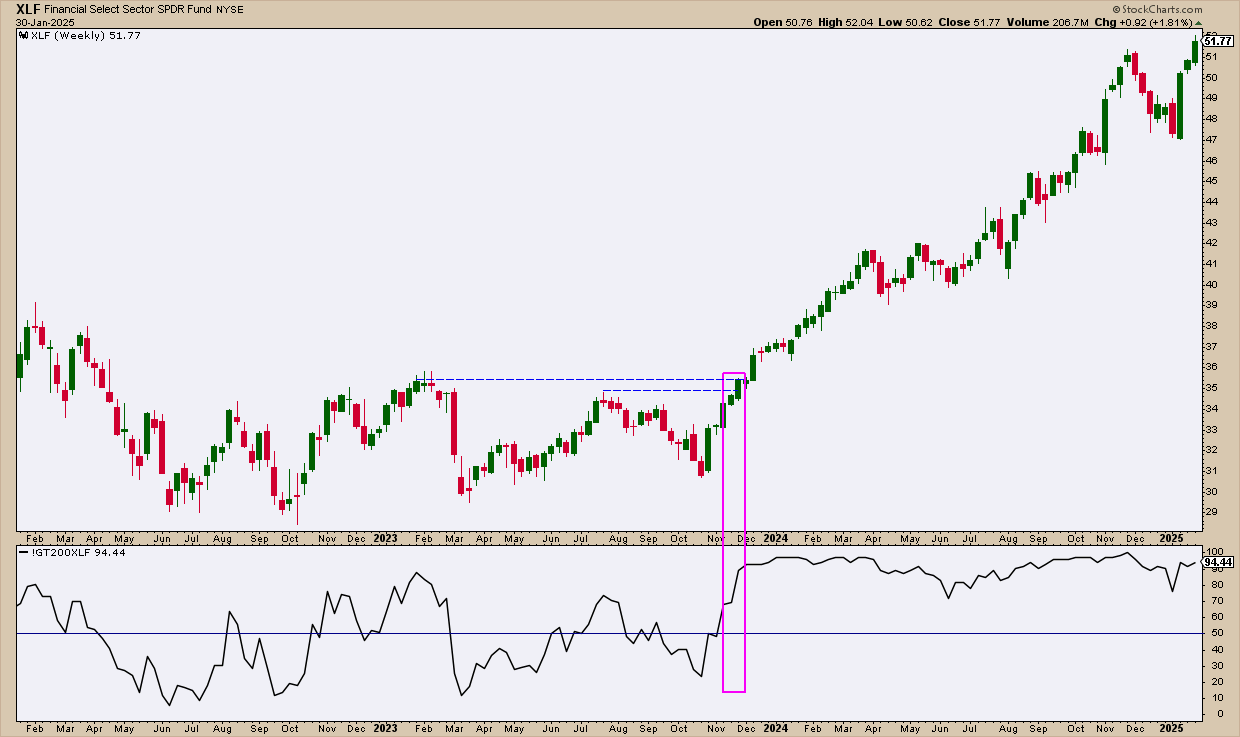
FIGURE 1. WEEKLY CHART OF XLF. Note how XLF has been trending steadily since late 2023. Chart source: StockCharts.com. For educational purposes.
XLF remained rangebound between just under $29 and $36 for almost a year and a half. During that period, it experienced two failed breakout attempts to the upside, followed by a lackluster retest. By the time XLF cleared the upper levels of the trading range (see blue dotted lines), more than 90% of S&P financial stocks were trading above their 200-period exponential moving average, as seen by the indicator in the bottom panel.
Let’s pause for a moment and discuss this indicator, which you can add this to your indicator window by selecting Price and typing in (!GT200XLF). This is a useful breadth indicator that tells you the percentage of stocks above a given moving average — in this case, the 200-period EMA. With more than 90% of S&P financial stocks trading above the 200-period EMA, the signal indicated a bullish level of internal strength that might have supported the case for buying the breakout when it finally occurred (see magenta rectangle).
Backup — Let’s Break Down XLF: The financial sector includes several industries. Since we’re discussing XLF, it’s important to mention that over 96% of the ETF is comprised of Financial Services, with the largest weighting going to bank stocks.
XLF rallied from the end of 2023 to the last months of 2024. After a brief pullback in the last two months of the year, XLF resumed its climb to its current levels.
Now let’s shift over to a daily chart.
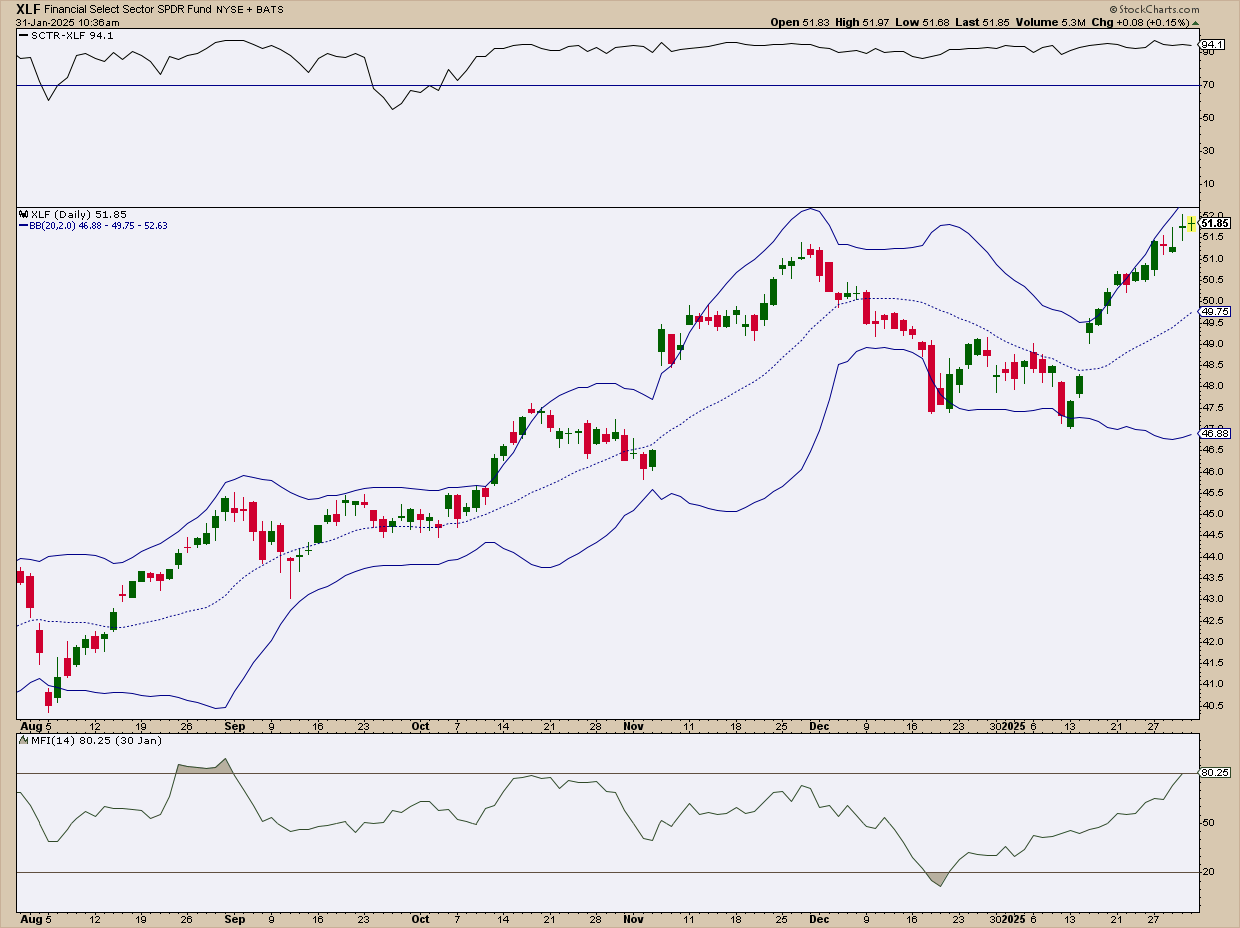
FIGURE 2. DAILY CHART OF XLF. Will the index pull back or continue advancing into record-high territory?Chart source: StockCharts.com. For educational purposes.
XLF’s technical strength has been net bullish over the entire period represented on the chart, as seen by the StockCharts Technical Rank (SCTR) reading displayed in the top panel.
The Money Flow Index (MFI), which considers momentum and volume, indicates that buying pressure is steady while remaining below overbought conditions. This signals that XLF is not topping out. However, the candles over the last few sessions also show that conviction on either side of the fence, bullish or bearish, remains low. There’s a possibility of a stall or pullback, and if either materializes, you can expect a reversion to the middle Bollinger Band, which might also serve as a sound entry point should the fundamental context remain favorable (note how the price action over the last six months seems to have responded well to Bollinger Band levels).
At the Close
Add XLF to your ChartLists and watch the levels discussed above. If you somehow bought the initial breakout, which didn’t show much bullish conviction, look to the middle Bollinger Band as a potential support level. A close below $47, the most recent swing low, would invalidate the current rally.
