

 With an new administration inbound in Washington, D.C., might now be a good time to jump into small-cap stocks?
If you’ve heard this maxim based on the Presidential Election Cycle Theory, it has some truth to it. Small-caps tend to thrive after presidential elections as attention shifts to domestic issues and governance. Since 1980, the Russell 2000 has averaged a 15% return in post-election years, outperforming large-cap stocks by about 4 percentage points.
Since we’re thinking about seasonality, what about small-cap seasonality on a year-round basis? How do small caps seasonally perform throughout the year, and is it a good time to jump in now?
Let’s get straight to it, starting with a 10-year seasonality chart of iShares Russell 2000 ETF (IWM), our small-cap proxy. If you click on the link above, be sure to toggle the timescale to 10 years (the chart’s default period is 5 years).
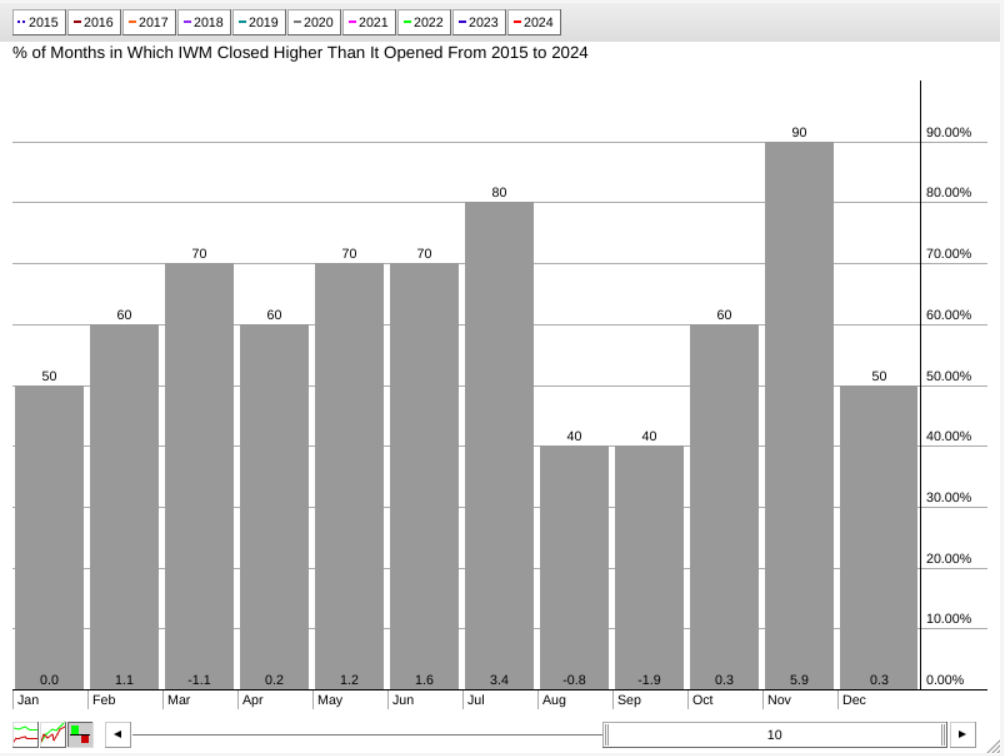
FIGURE 1. 10-YEAR SEASONALITY CHART OF IWM. Note that November is IWM’s strongest month. The average higher close rate is the number above the bars, while the average returns are at the bottom of the bars just above the months.Chart source: StockCharts.com. For educational purposes.
Over the last 10 years, November has been IWM’s strongest seasonal month, averaging a 90% higher close rate and a nearly 6% monthly return. While December and January are seasonally tepid, February through July are consistently strong. With 2025 following an election year, investors may find small caps an attractive investment opportunity.
If you want to add the Russell 2000 to your portfolio, you’ll want to fine-tune an entry point. But how? First, examine a weekly chart of IWM to understand the larger context of the index’s current price action.
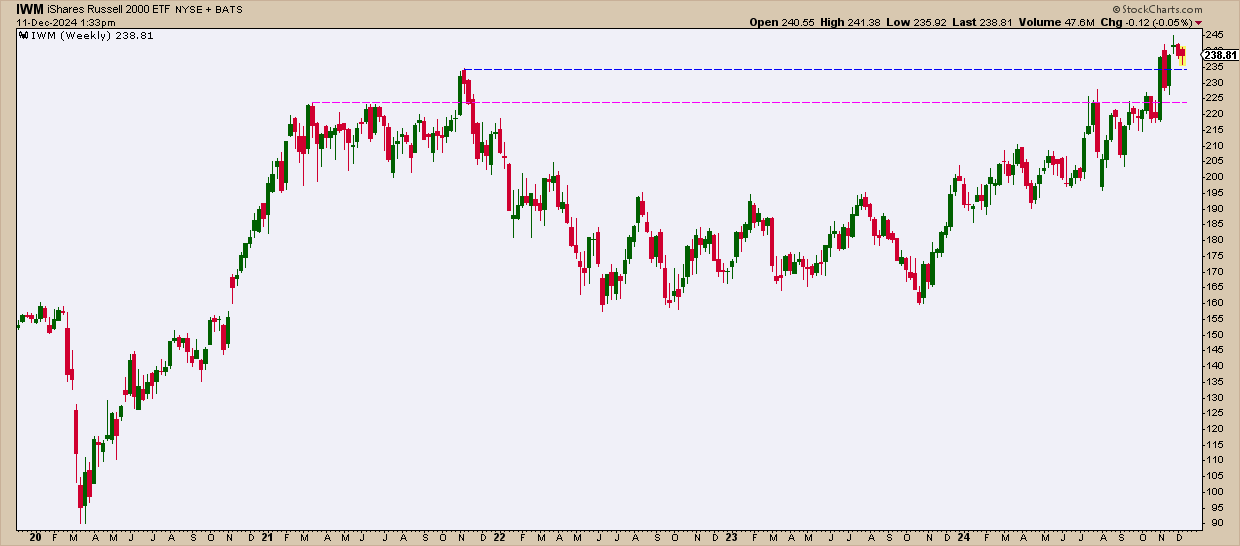
FIGURE 2. WEEKLY CHART OF IWM. It helps to pay attention to the resistance levels going back to 2020.Chart source: StockCharts.com. For educational purposes.
Look at the two resistance levels marked by the magenta and blue dotted lines. Notice the difficulty IWM experienced breaking above the first level (magenta), at $224, from the end of July to November, forming an ascending triangle. As IWM broke through that contested level, it also broke above the second level of resistance (blue line) and its all-time high at $234.50.
Having pulled back slightly after breaking through two major resistance levels, bulls aiming to add positions are probably looking for a well-timed entry point. Let’s shift to a daily chart.
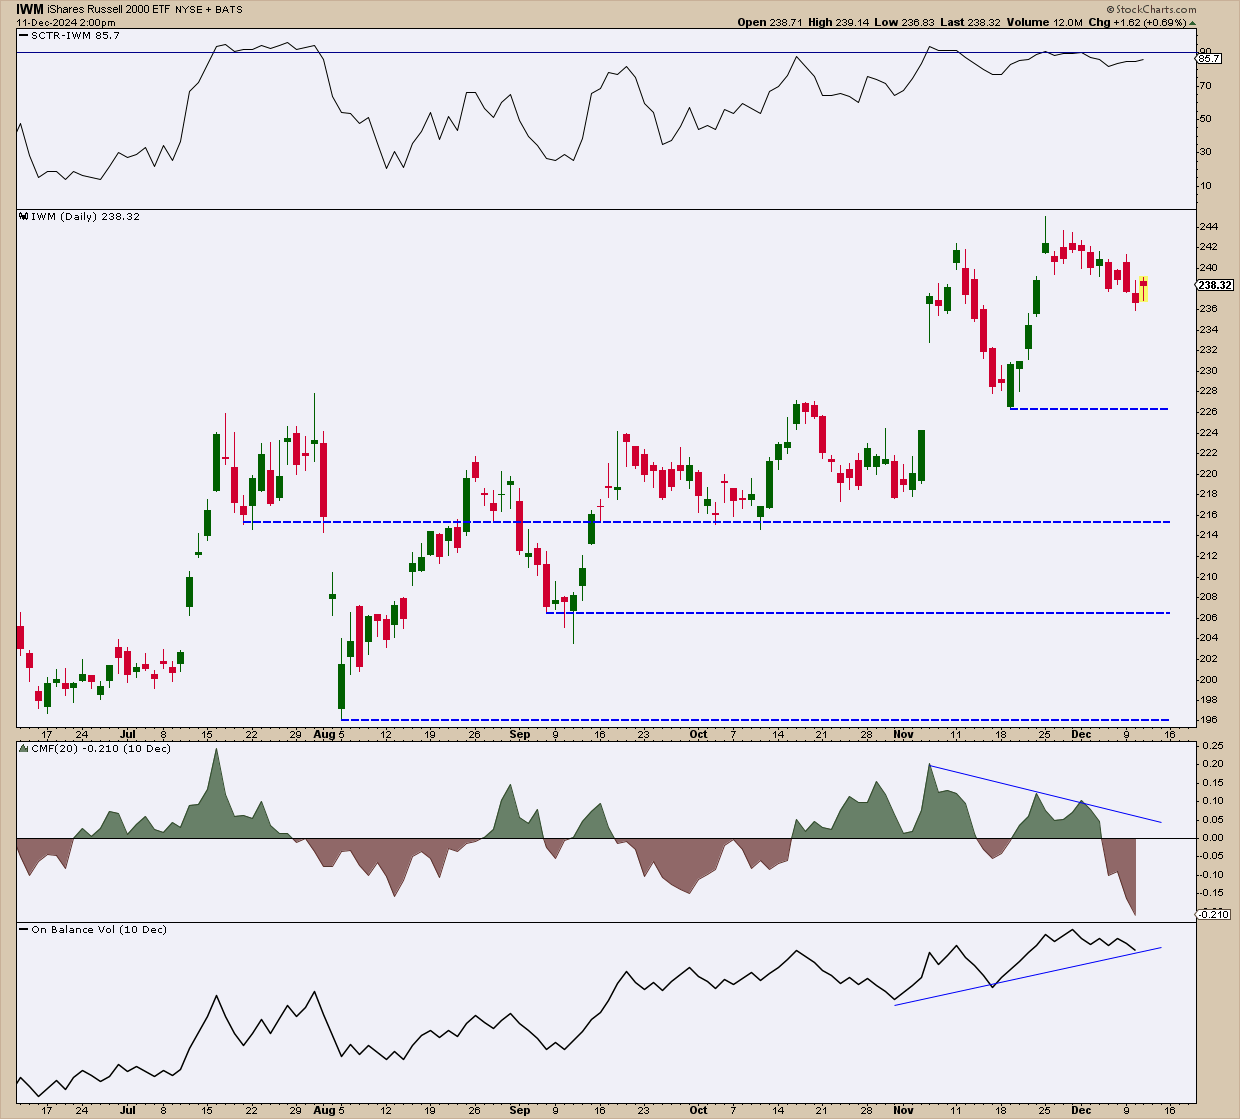
FIGURE 3. DAILY CHART OF IWM. Keep an eye on the swing lows marked by the blue dashed horizontal lines.Chart source: StockCharts.com. For educational purposes.
First off, IWM’s technicals demonstrate strength, as shown by the StockChartsTechnicalRank (SCTR) line, currently sitting just below the bullish 90-level threshold. However, the two volume-based indicators—Chaikin Money Flow (CMF) and On Balance Volume (OBV)—show a stark divergence. This can indicate, among other things, that selling pressure is prominent on the institutional side, while retail investors are driving up buying pressure (institutional players have the upper hand in most cases).
As IWM’s price pulls back, be mindful of the swing lows, each marked by a blue dotted line in the chart. Though you can expect those levels to serve as support, I’d be wary if the price closes below $215. Not only would that invalidate the near-term uptrend (no longer seeing higher highs and higher lows), but it would also fall into a range muddled with historical congestion (as seen in the weekly chart).
If IWM bounces above $226 or $215, look at the volume-based indicators to see if buying pressure on both indicates bullish alignment. Direction in volume often precedes price, so keep an eye on each. Hopefully, a strong bounce on high volume will mark a well-timed entry into the index ETF.
At the Close
Small-cap stocks have a history of shining in post-election years and thriving in specific seasonal windows, like November and the spring months. But timing is everything, so add this chart to your ChartList and watch the levels and indicators discussed above. Should conditions shift favorably, you can decide whether it’s the right time to pull the trigger.

Disclaimer: This blog is for educational purposes only and should not be construed as financial advice. The ideas and strategies should never be used without first assessing your own personal and financial situation, or without consulting a financial professional.