

 As the year winds down, investors are beginning to position their portfolios for the New Year. I’m considering it, and perhaps you are too.
Next year, in addition to the seasonal rotations among sectors, we have a plot twist: a new administration in D.C. likely to bring disruptive policy changes affecting the market.
The Financials sector is expected to perform well under the new administration. If that’s the case, it’s worth taking a closer look at this sector and identify which stocks to watch for potential buy opportunities. If you’re already considering financial stocks and looking to fine-tune an entry before year-end, then consider those that have pulled back or are trading in a tight, low-volatility consolidation range—prime candidates for a potential bounce.
How can you spot these opportunities? One way is to use MarketCarpets’ Bollinger Band Width setting.
On Monday, I used this tool with the Latest Value setting, which provides a score between 0 to 100. The closer to zero, the narrower the BandWidth. The narrower the BandWidth, the greater the likelihood of spotting a “squeeze” leading to a significant price move or a breakout.
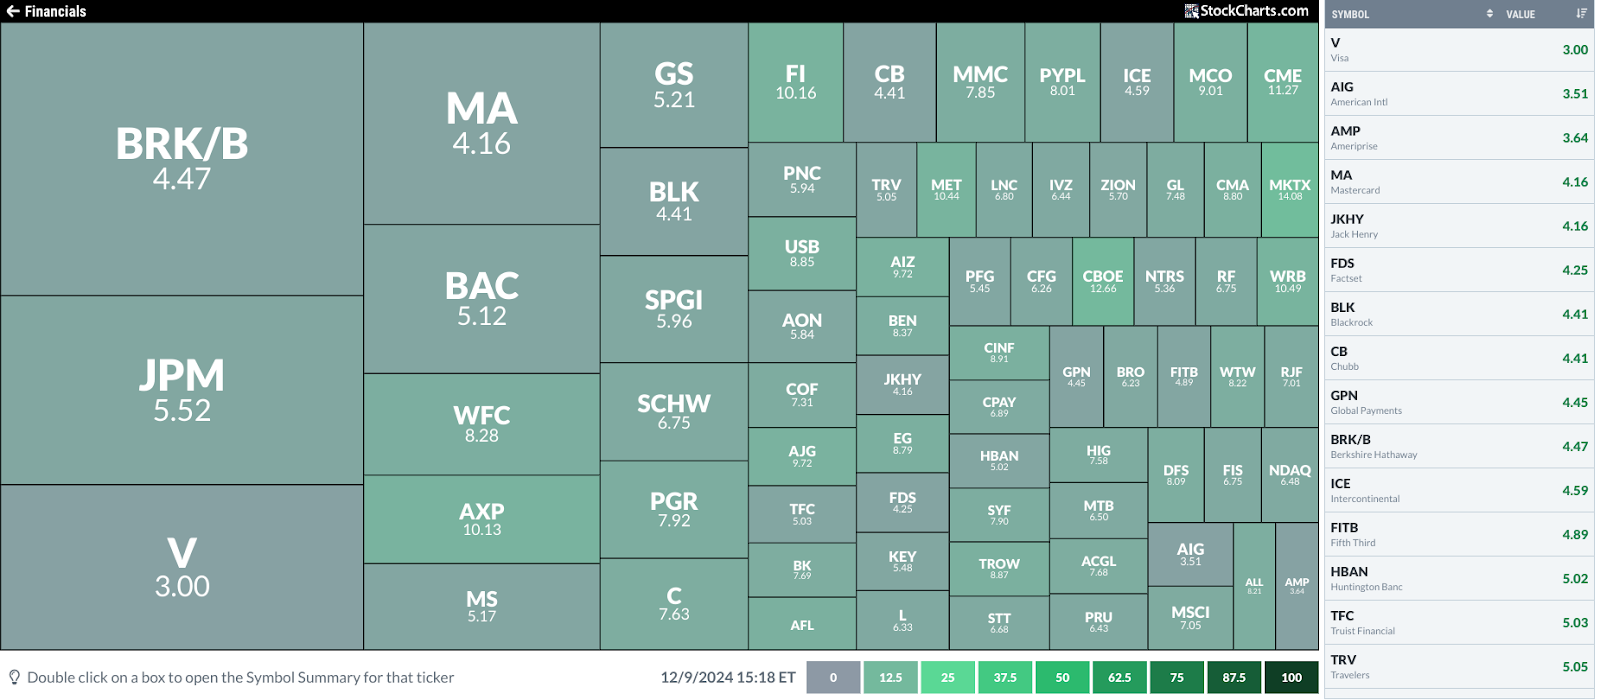
FIGURE 1. MARKETCARPETS BOLLINGER BAND WIDTH SET TO LATEST VALUE. It won’t be surprising if most of the big stocks on the list with the lowest value exhibit similar patterns.Image source: StockCharts.com. For educational purposes.
If you look at the table on the right, you’ll see that the three biggest stocks with the lowest chart values are Visa (V), Mastercard (MA), and Berkshire Hathaway B shares (BRK/B). If you were to continue scrolling, the three big banks with the narrowest Bollinger Bandwidths are Bank of America (BAC), Morgan Stanley (MS), Goldman Sachs (GS), and JP Morgan Chase (JPM). For many investors, some of these shares are quite expensive. So, let’s consider that and focus on the stocks that are more relatively affordable to most readers: BAC, MS, and JPM.
Before diving into these stocks, let’s examine the sector’s breadth using a daily chart of the S&P FInancial Bullish Percent Index ($BPFINA). We’ll also compare the relative performance of the Invesco KBW Bank ETF (KBWB) as a proxy for the large U.S. banking industry against the Financial Select Sector SPDR (XLF), which represents the broader financials sector.
Sector Breadth and Relative Performance of Banks vs. Sector
The $BPFINA shows the percentage of stocks signaling Point & Figure “buy” signals. Right now, 91% of S&P financial stocks are flashing buy signals (see below).

FIGURE 1. FINANCIAL SECTOR BULLISH PERCENT INDEX. The Financial sector is bullish but potentially oversold.Chart source: StockCharts.com. For educational purposes.
While a BPI figure above 50% is bullish, above 70% signals that the sector is potentially overbought. On an industry level, the banking industry is outperforming broader financials by 11% and rising.
Bank of America
Let’s get to the stocks, starting with a daily chart of BAC.
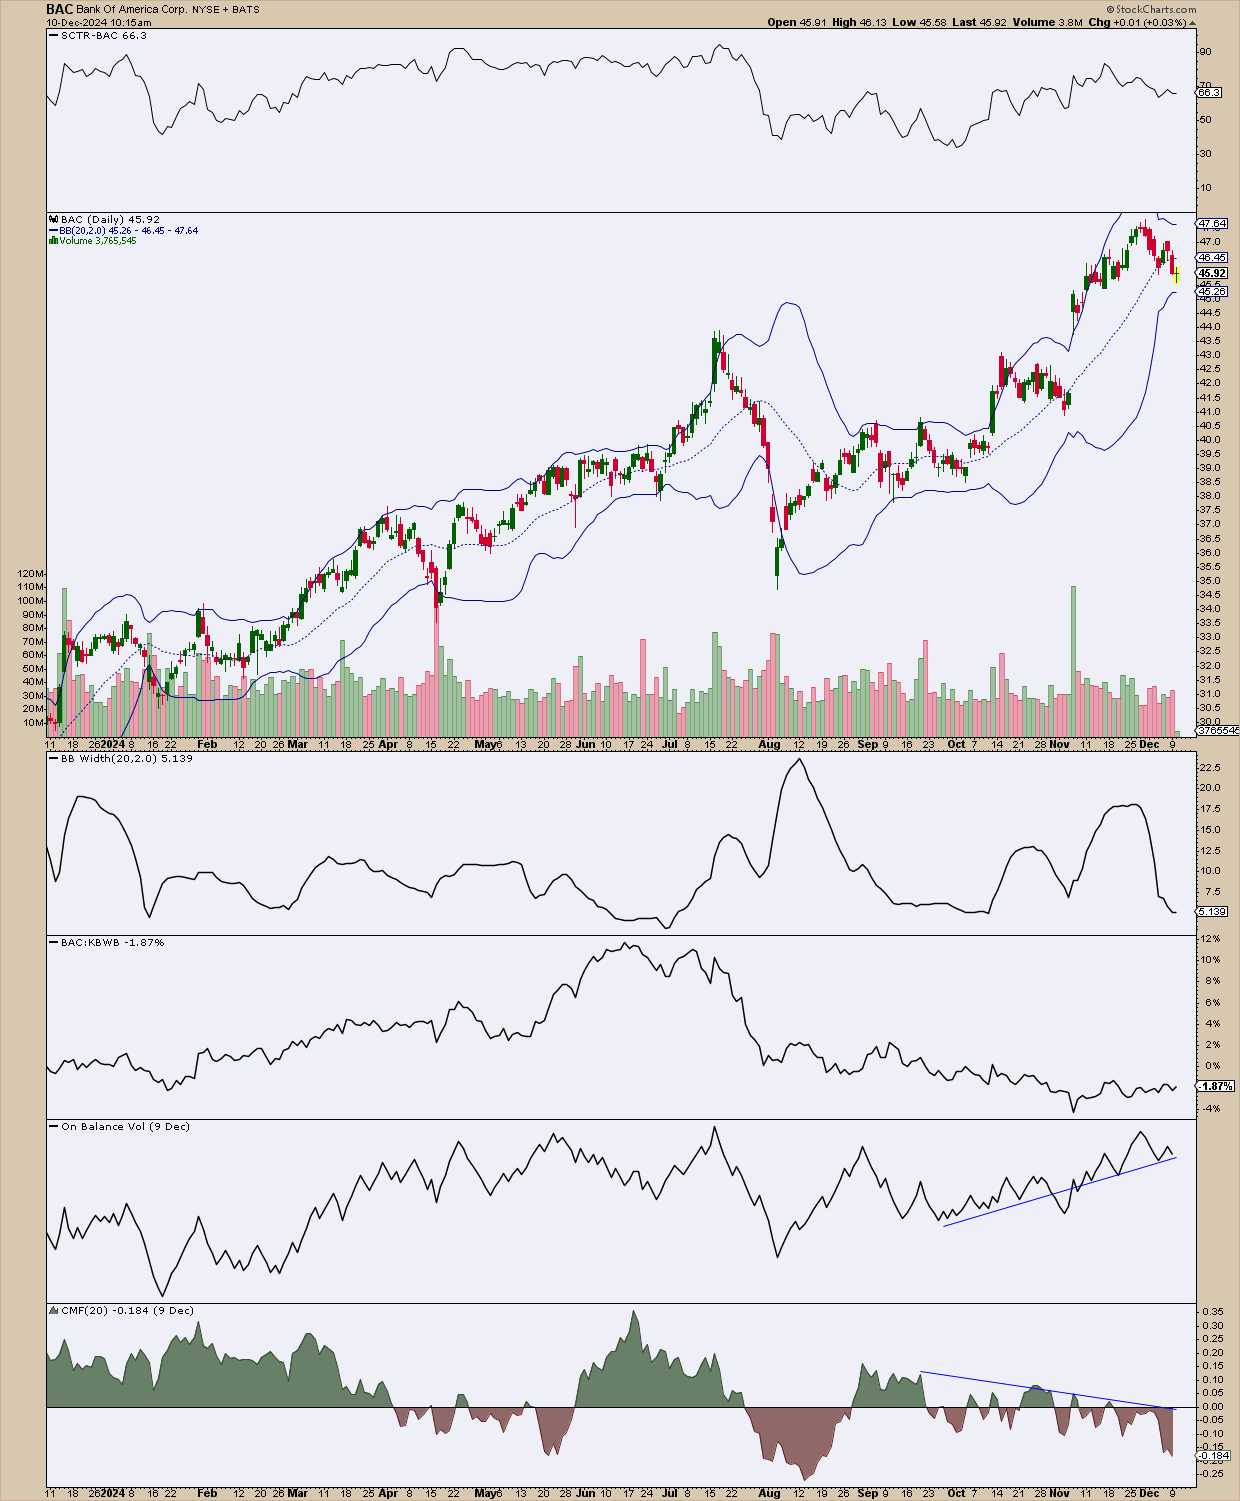
FIGURE 2. DAILY CHART OF BANK OF AMERICA. Is the stock poised for a big move up or down?Chart source: StockCharts.com. For educational purposes.
There’s a lot here, so I’ll bullet the key points:
- BAC’s technical strength, as measured by the StockChartsTechnical Rank (SCTR) is slightly declining, but at a level just below 70, it signals only slight weakness.
- The Bollinger BandWidth has decreased significantly, and BAC’s price is above the lower band. This doesn’t signify a squeeze as much as a low volatility pullback. But what are the chances that BAC is likely to decline further?
- On a relative performance scale, BAC is slightly underperforming its industry, down barely 2%.
- In terms of momentum, there’s a divergence between indicators: On Balance Volume (OBV) suggests high buying pressure, possibly driven by retail investors, while Chaikin Money Flow (CMF) indicates strong selling pressure, likely reflecting institutional activity.
BAC is one of the largest US banks, so I’d add it to my ChartList as a possible prospect for a longer-term investment. However, given the mixed technical signals, I consider this a wait-and-see moment, observing how price reacts at current levels and whether the OBV and CMF can align if BAC continues its move to the upside.
How does BAC compare with Morgan Stanley?
Morgan Stanley
Let’s take a look at a daily chart.

FIGURE 3. DAILY CHART OF MS. The stock’s performance, as measured by SCTR, is performing slightly better than BAC.Chart source: StockCharts.com. For educational purposes.
- MS’s SCTR score, at 83, is stronger than BAC’s and close to the 90 level, which might be considered exceedingly bullish.
- As its Bollinger BandWidth narrows, the stock has also fallen below support, coming out of a rounding top, and looking to fill the wide gap made at the beginning of November.
- MS is slightly outperforming its industry peers by slightly over 3%, better than BAC’s relative performance.
- Selling pressure, however, is strong, and the OBV and CMF appear to align.
This appears to be a classic pullback scenario. I would add this to my ChartList, as MS is one of the biggest players in the industry, but I’d wait for a bounce and monitor a bullish reversal in both the OBV and CMF before considering a long position.
JP Morgan Chase
Finally, let’s look at the last big bank on my list: JP Morgan Chase. Below is a daily chart.
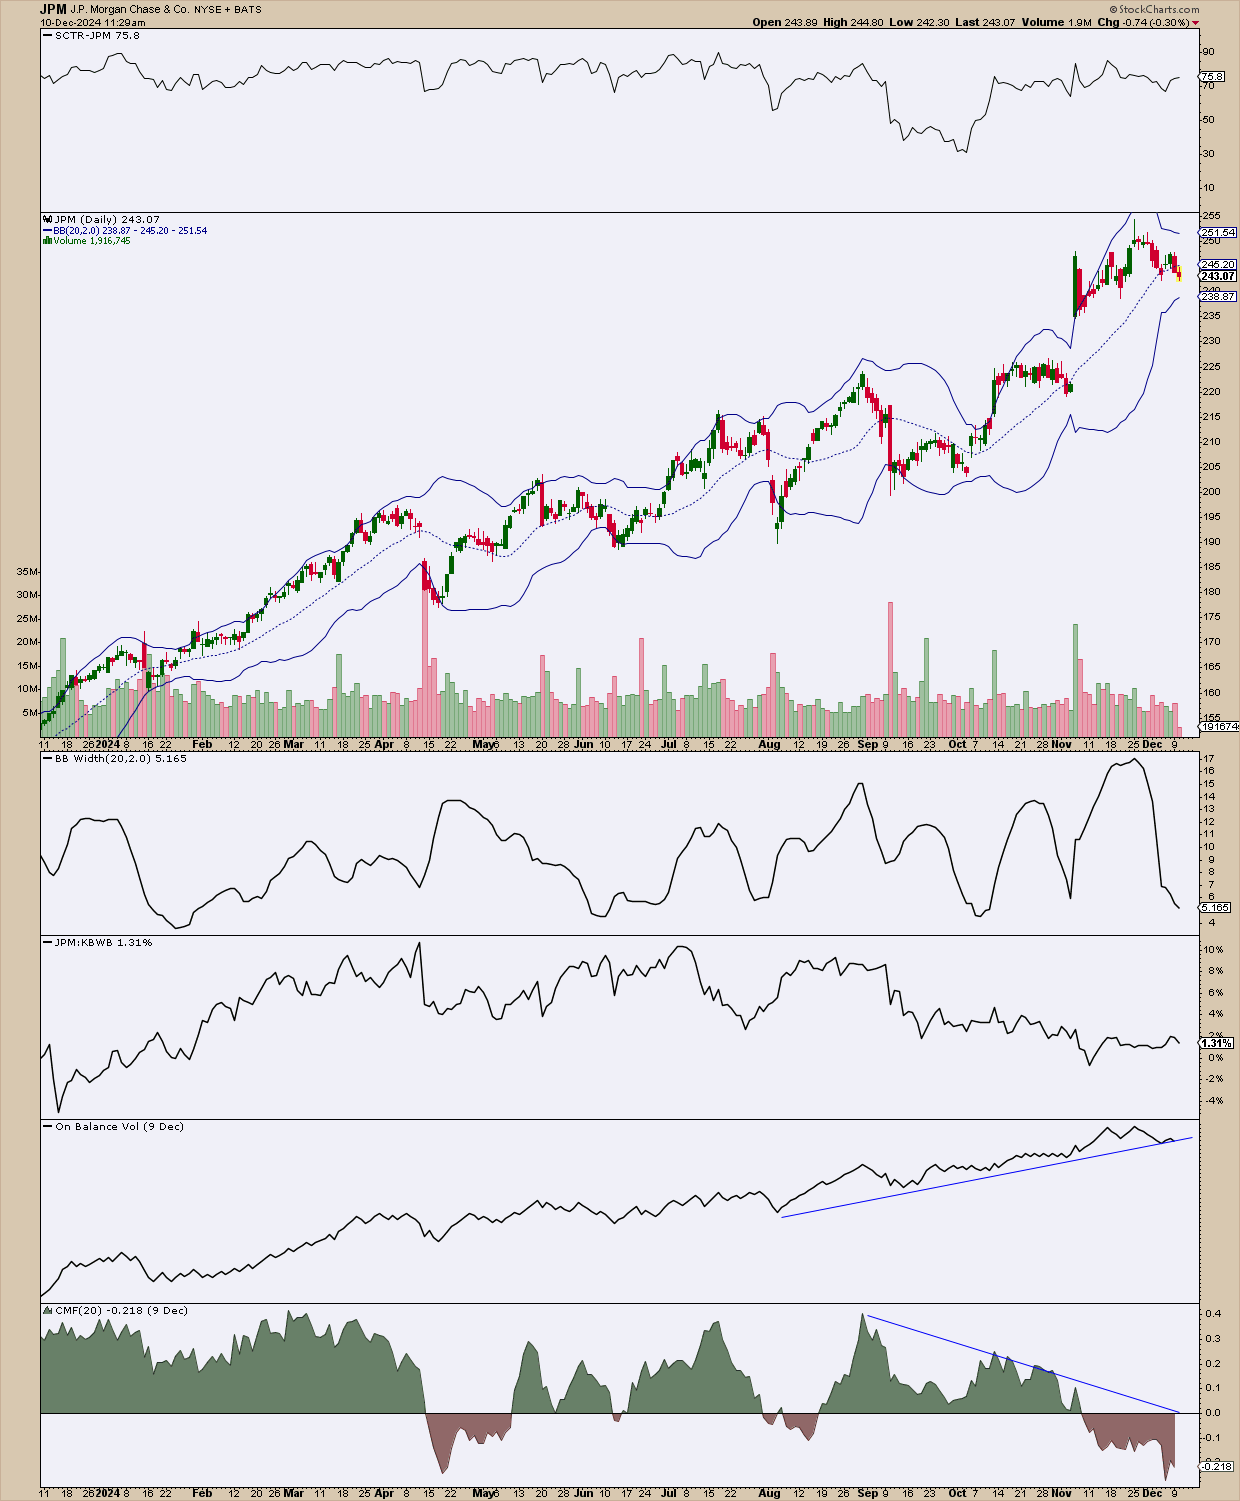
FIGURE 4. DAILY CHART OF JPM. The divergence in the OBV and CMF is something to watch carefully.Chart source: StockCharts.com. For educational purposes.
- JPM’s SCTR score of 76 is declining, yet still relatively bullish.
- Its Bollinger BandWidth indication is similar to the two we just viewed. In JPM’s case, traders seem hesitant to commit to any direction as price settles right below the middle band. It’s as if they’re waiting for some indication to trigger movement in one direction or another.
- Regarding relative performance, JPM is barely outperforming its industry peers, by a little over 1%.
- Similar to the BAC example, there appears to be a potential, yet prominent divergence between retail buying and institutional selling, as the OBV has been climbing while the CMF has been steadily declining.
JPM is sitting in a near-term holding pattern. It’s going to break eventually. But for now, the market appears unable to commit to a given direction, and the mixed momentum signals seem to support this view. It’s best to monitor this on my ChartList and wait for stronger bullish signals and a definitive reversal to the upside before jumping in. In short, patience.
At the Close
Planning the coming year, I focused on a given sector (Financials) and used MarketCarpets’ Bollinger BandWidth setting to identify stocks with tight, low-volatility setups that might signal a breakout opportunity. This led me to BAC, MS, and JPM. While these stocks remain on my ChartList as longer-term prospects, I’m opting for a wait-and-see approach. Fine-tuning an entry is important. And while there are many ways you can do this, I just showed you one approach that might just come in handy given the right circumstances.

Disclaimer: This blog is for educational purposes only and should not be construed as financial advice. The ideas and strategies should never be used without first assessing your own personal and financial situation, or without consulting a financial professional.