

 The broader stock market indexes sold off slightly ahead of the November Non-Farm Payrolls data, which will be released Friday morning. Depending on which way the data goes, the market could sell off further or continue its bullish ride. If the market sells off, which stocks are flashing buy signals? To help me identify stocks to watch, I ran my StockCharts Technical Rank (SCTR) scan to identify which stocks were gaining technical strength.
My SCTR scan filtered 53 stocks and ETFs, which I sorted based on the universe (U) (the scan syntax is at the end of the article). I prefer to look at large-cap stocks and identify which ones are potential investing candidates. Going down Thursday’s list, the first stock that interested me was Cisco Systems (CSCO), mainly because of its simple and clear-looking chart.
Simplicity Attracts
The weekly chart of CSCO stock shows it reached a new all-time high on a relatively sharp upside move since the week of September 9. CSCO’s stock price is trading above its 5-week exponential moving average (EMA) and its 15-week simple moving average (SMA).
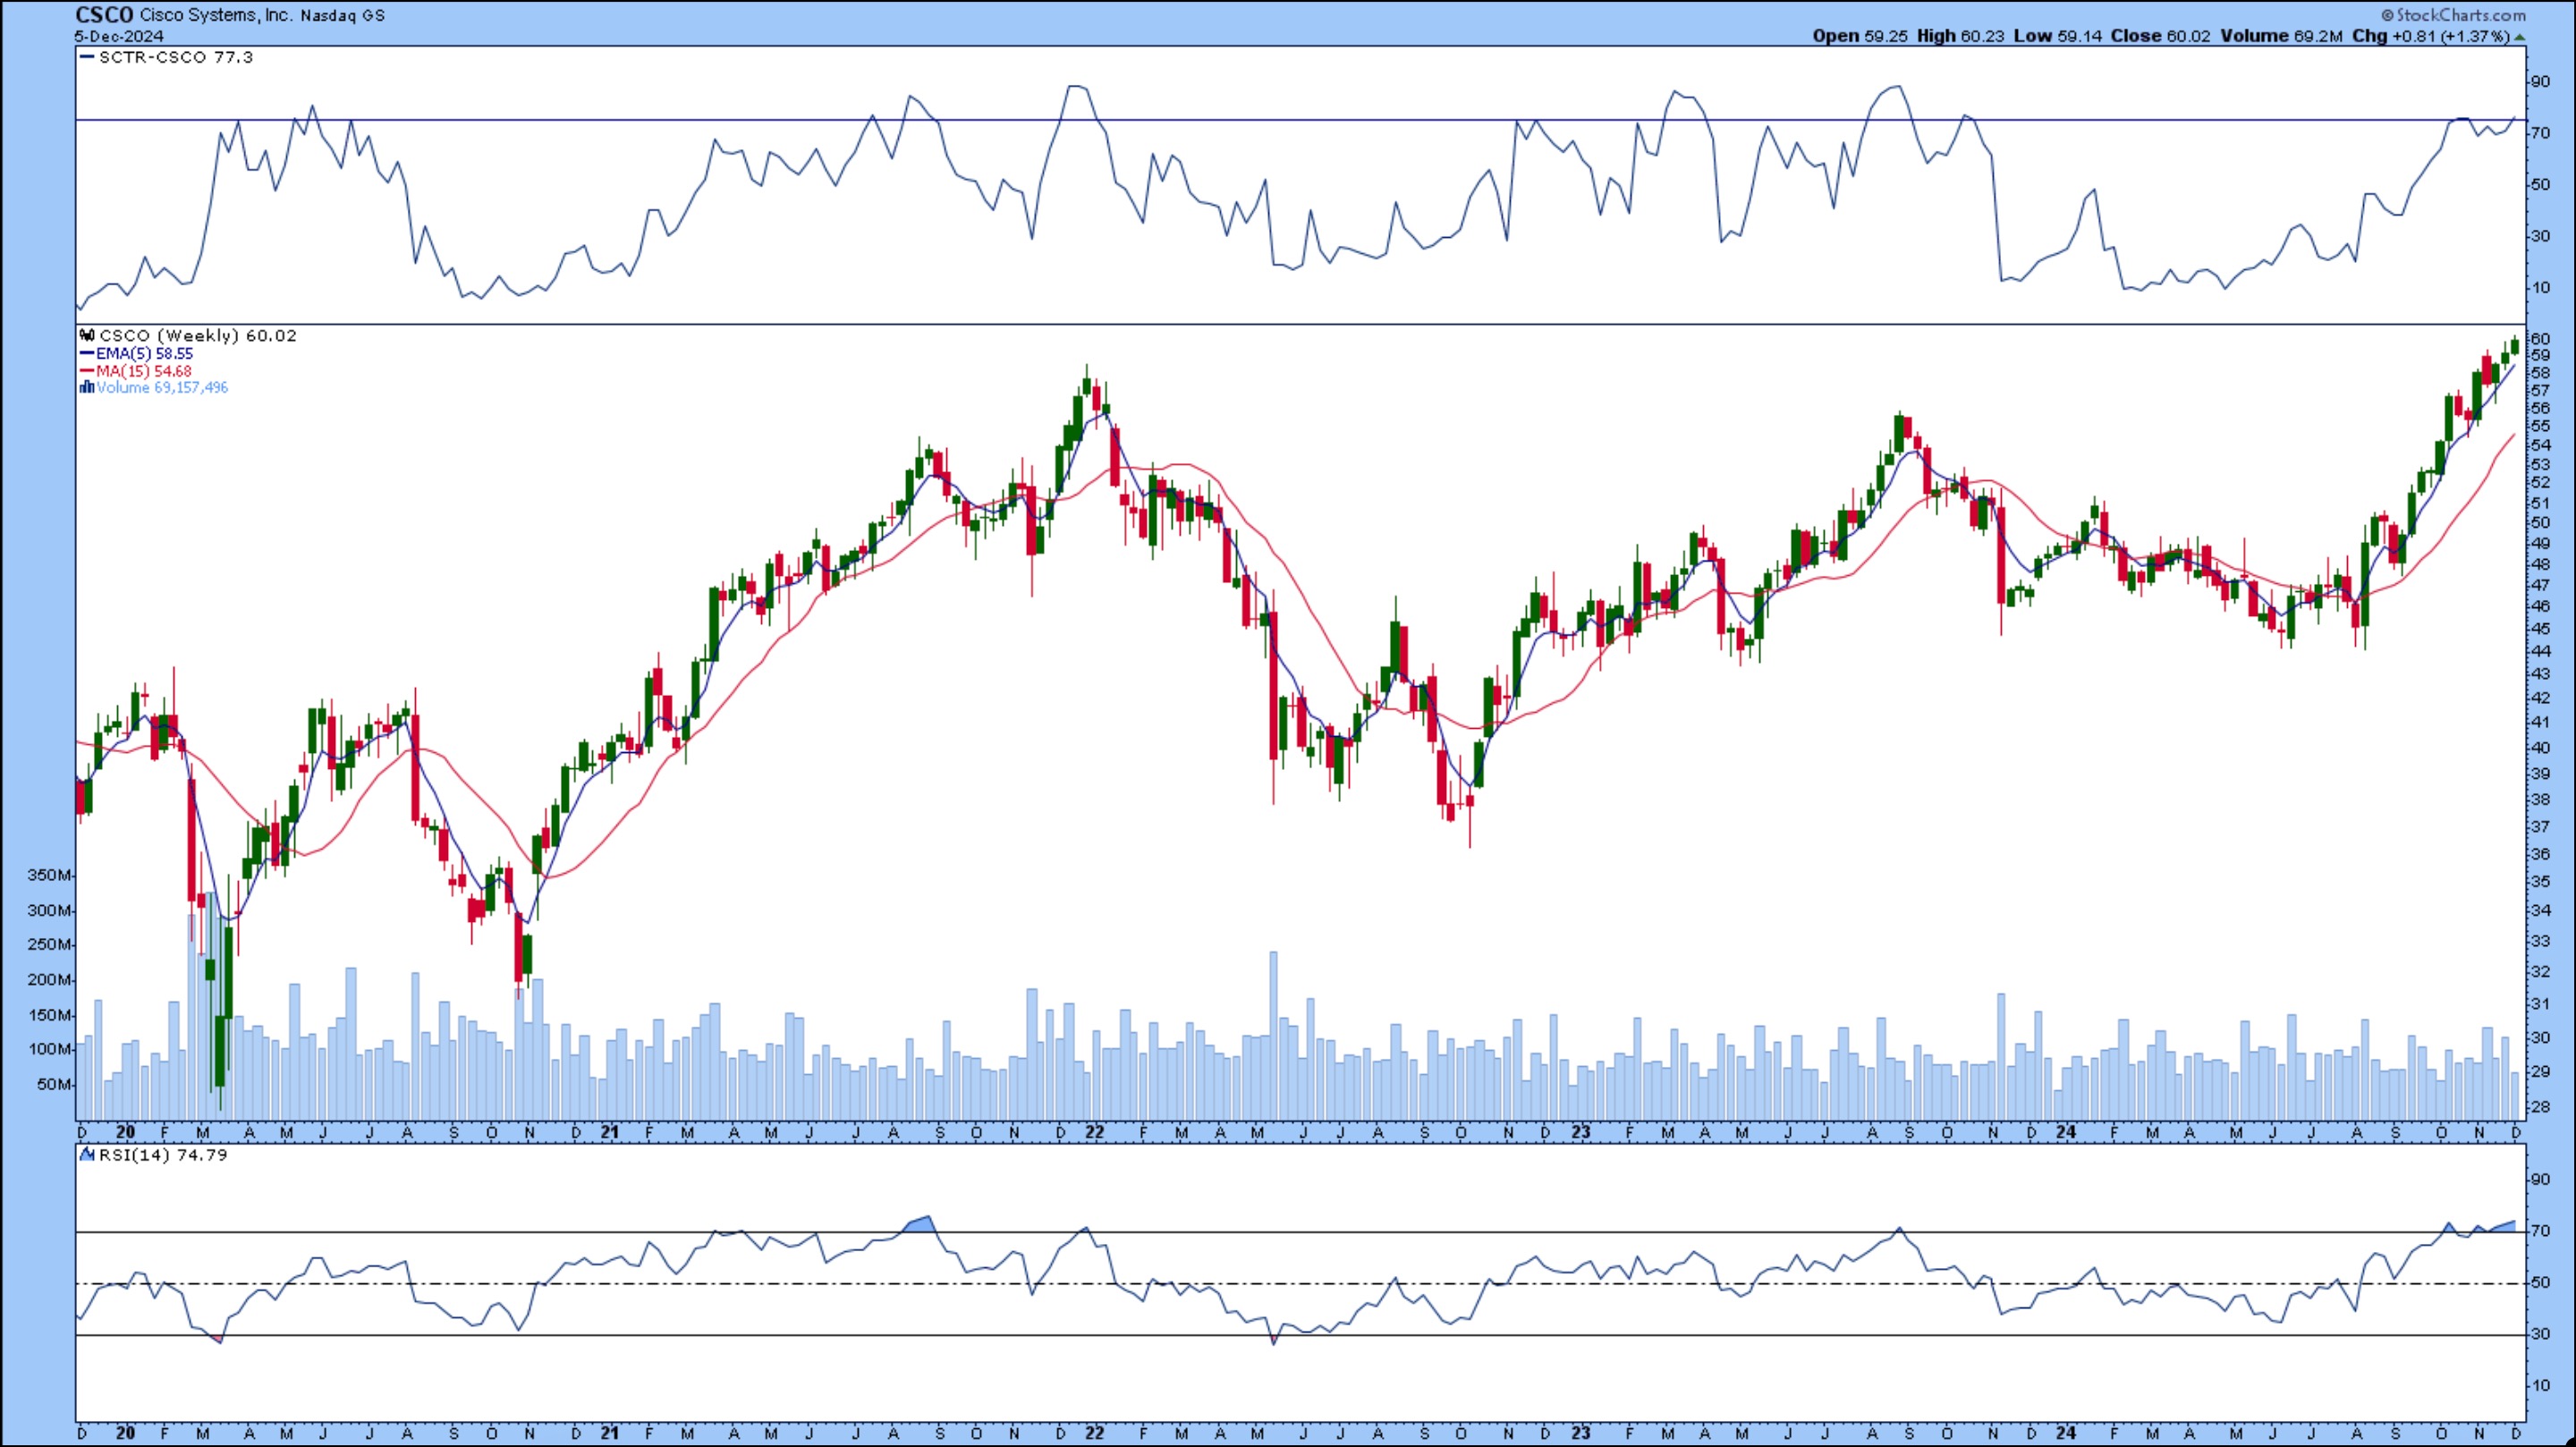
FIGURE 1. WEEKLY CHART OF CSCO STOCK. The SCTR score is just above 76, the stock price is trading above its 5-week EMA, and its RSI has crossed above 70. There’s no indication of a reversal in the uptrend.Chart source: StockCharts.com. For educational purposes.
The SCTR score has crossed above the 76 threshold, and its relative strength index (RSI) is just above 70. From the data in the Symbol Summary page for CSCO, the stock is up 29.29% over one year. These are all indications that the price action in CSCO stock remains bullish.
Let’s now examine the daily chart of CSCO stock to determine whether it is worth buying and what the ideal entry and exit points will be. The daily chart confirms the shorter-term trend is still up. The upward-sloping trendline coincides with the 21-day EMA, and trading volume is slightly increasing.
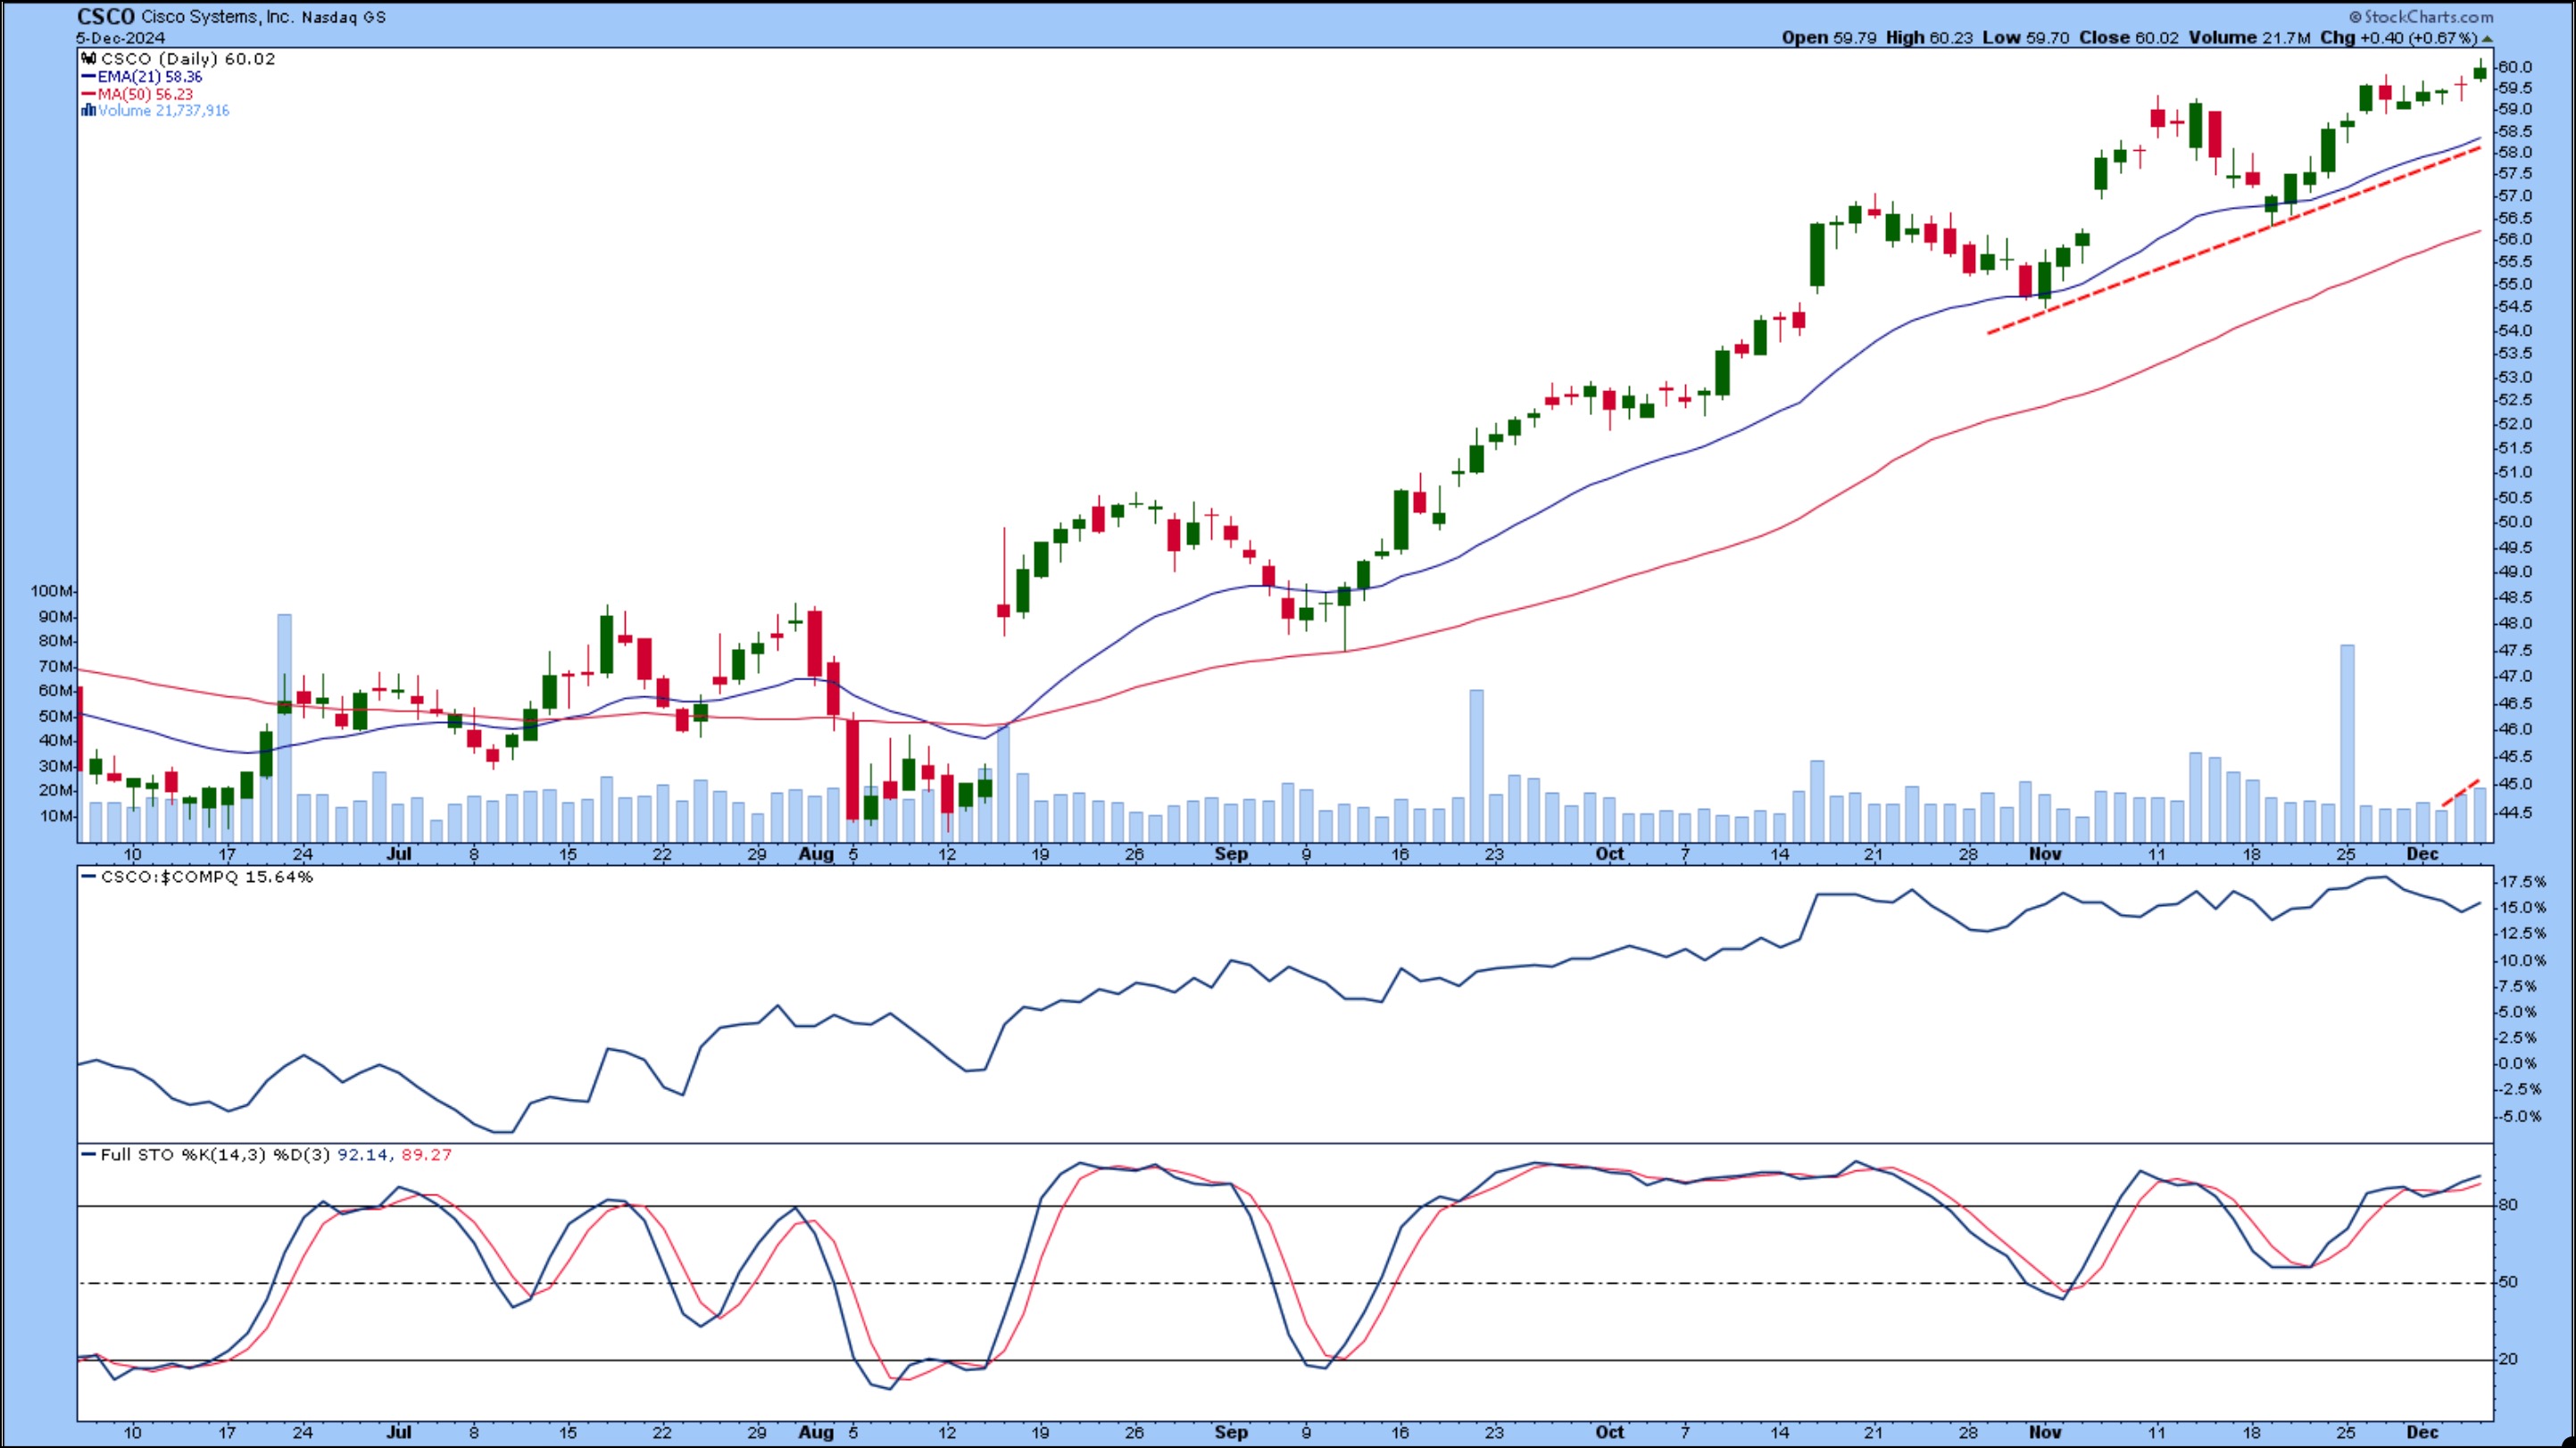
FIGURE 2. DAILY CHART OF CSCO STOCK. The stock has retained its uptrend bouncing off its 21-day EMA. CSCO is also outperforming the Nasdaq Composite slightly. The Full Stochastic oscillator indicates the stock is overbought.Chart source: StockCharts.com. For educational purposes.
CSCO’s performance shows it’s outperforming the Nasdaq Composite ($COMPQ) by 15.64% (see panel below CSCO stock price chart). The Full Stochastic oscillator shows the stock is overbought but, as you can see from past data, the oscillator can stay overbought for an extended period.
The Game Plan
CSCO may not be as glamorous as some of the other mega-cap tech stocks, but its path is a steady and slow uptrend. This may be the reason it’s outperforming the Nasdaq and possibly some of the other more volatile mega-cap stocks, such as NVIDIA Corp. (NVDA), Microsoft Corp. (MSFT), and Apple, Inc. (AAPL).
If CSCO’s price action continues grinding higher slowly and steadily, I would look for a pullback, which might be to the 21-day EMA or above. I’ll watch the market closely on Friday after the November NFP report is released to see if there’s a selloff or if market continues rising higher.
As long as the technicals stay in place for an uptrend, the stock is a buy. When any of the indicators no longer support the uptrend, you abandon the stock or do not even consider buying it.
Sometimes, as Bruce Lee would say, “Simplicity is the key to brilliance.”
The SCTR Scan
[country is US] and [sma(20,volume) > 100000] and [[SCTR.us.etf x 76] or [SCTR.large x 76] or [SCTR.us.etf x 78] or [SCTR.large x 78] or [SCTR.us.etf x 80] or [SCTR.large x 80]]

Disclaimer: This blog is for educational purposes only and should not be construed as financial advice. The ideas and strategies should never be used without first assessing your own personal and financial situation, or without consulting a financial professional.